Start.io audiences
Burger Lovers
in New Hampshire

overview
Burger lovers enjoy sinking their teeth into a patty with all the toppings and sauces they love. Of the consumers who are identified as Burger Lovers in New Hampshire, 55.7% are in the 18-24 age group. Get more insights about this consumer group in the following charts.


Country
United States
State
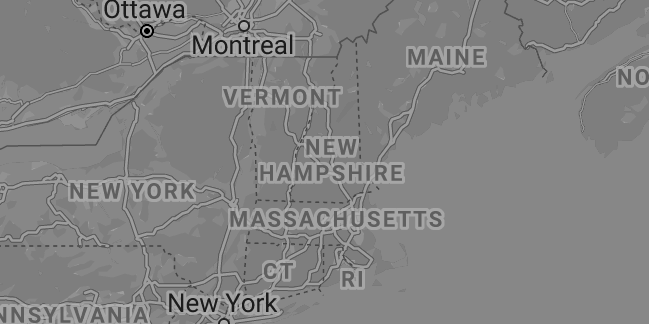
New Hampshire
Population
1,359,711
Area
8,953 sq mi

INSIGHTS ON Burger Lovers in New Hampshire
Age
55 years and above 7.2%
45-54 years 4.1%
35-44 years 9%
25-34 years 24%
18-24 years 55.7%
Gender
Male (52%)
Female (48%)
Household income
Less than $25,000 24.4%
$25,000 to $39,999 11.8%
$40,000 to $59,999 19.6%
$60,000 to $74,999 7.5%
$75,000 to $99,999 14.7%
$100,000 to $149,999 22%
$150,000 and above %
OS
Android (69.5%)
iOS (30.5%)
Leading carriers
01 Verizon
02 T-Mobile
03 U.S. Cellular
5 most visited places/venues
01 Aeroballoon
02 Clover Food Lab
03 Park Street MBTA Station Green & Red Line
04 Franklin Square
05 Rogers Park
Updated: 11-2024