Start.io audiences
Users Spending Between 20-25 Percent of Income on Rent
in Riverside

overview
These statistics show insights and characteristics for people who spend 20-25% of their income on rent. Of the consumers who fall into this segment in Riverside, 41.7% are in the 18-24 age group. Get more insights about this group in the following charts.


Country
United States
City
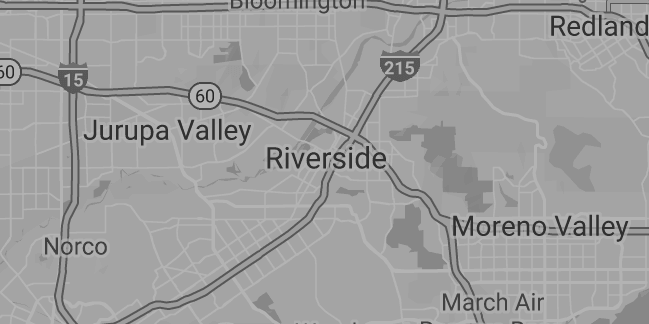
Riverside, California
Population
331,360
Area
81 sq mi

INSIGHTS ON Users Spending Between 20-25 Percent of Income on Rent in Riverside
Age
55 years and above 9.7%
45-54 years 6.3%
35-44 years 12.7%
25-34 years 29.6%
18-24 years 41.7%
Gender
Male (54.4%)
Female (45.6%)
Household income
Less than $25,000 27.6%
$25,000 to $39,999 26.1%
$40,000 to $59,999 11.8%
$60,000 to $74,999 7.6%
$75,000 to $99,999 17.5%
$100,000 to $149,999 9.4%
$150,000 and above %
OS
Android (82.2%)
iOS (17.8%)
Leading carriers
01 Verizon
02 T-Mobile
03 T-Mobile
5 most visited places/venues
01 Centennial Park
02 Challen Hill Park
03 Challen Park
04 La Sierra Park
05 University Of California Riverside
Updated: 11-2024