Start.io audiences
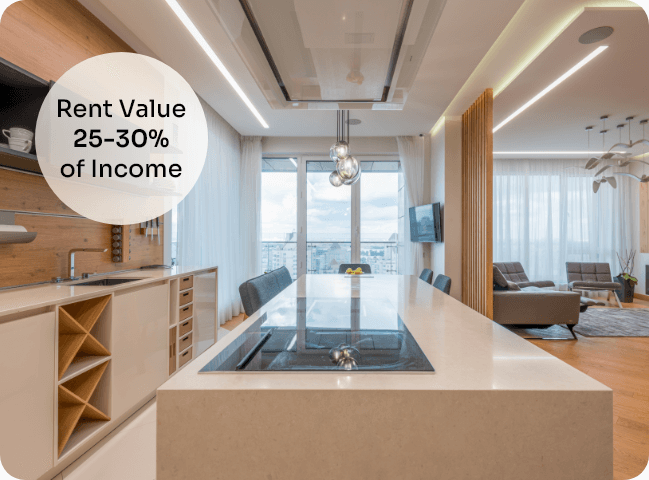
Users Spending Between 25-30 Percent of Income on Rent
in Tulsa
overview
Users whose rent is 25-30% of their income share some characteristics. The top mobile device for Users Spending Between 25-30 Percent of Income on Rent in Tulsa is Apple iphone1,1. More interesting statistics about this segment can be found in the charts below.
Country
United States
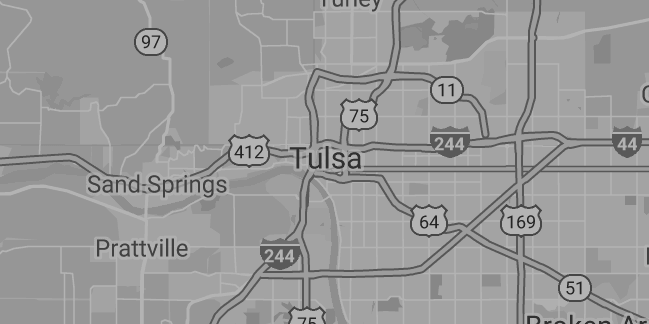
City
Tulsa, Oklahoma
Population
401,190
Area
196 sq mi
INSIGHTS ON Users Spending Between 25-30 Percent of Income on Rent in Tulsa
Age
55 years and above 31.6%
45-54 years 23.2%
35-44 years 16.2%
25-34 years 8.7%
18-24 years 20.2%
Gender
Male (15.1%)
Female (84.9%)
Household income
Less than $25,000 39.3%
$25,000 to $39,999 24.1%
$40,000 to $59,999 13.8%
$60,000 to $74,999 6.5%
$75,000 to $99,999 4.5%
$100,000 to $149,999 11.3%
$150,000 and above 0.5%
OS
Android (76.9%)
iOS (23.1%)
Top devices
01 Apple iphone1,1
02 Samsung Galaxy A15 5G
03 Samsung Galaxy A14 5G
04 Samsung Galaxy A16 5G
05 motorola moto g play - 2024
Leading carriers
01 AT&T
02 AT&T
5 most visited places/venues
01 Myriad Gardens
02 Aaronson Park
03 Wedgewood Park
04 Wedgewood Homeowners
05 Henthorne Park
Updated: 07-2026