Start.io audiences
Users Who Make In-App Purchases
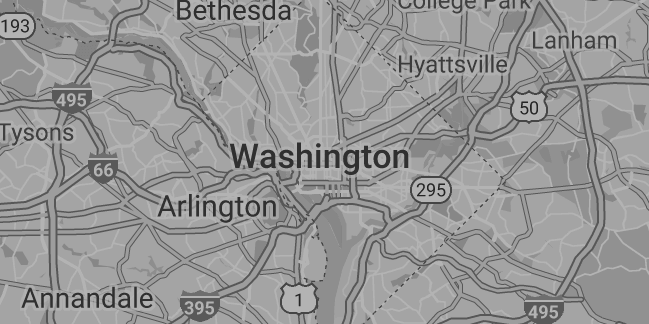
in Washington, D.C.

overview
These statistics show insights and characteristics for Users Who Make In-App Purchases. Users Who Make In-App Purchases in Washington, D.C. have chosen the as their device of choice. Learn more about the defining characteristics of Users Who Make In-App Purchases through the charts below.


Country
United States
City
Washington, D.C., District of Columbia
Population
705,749
Area
61 sq mi

INSIGHTS ON Users Who Make In-App Purchases in Washington, D.C.
Age
55 years and above 4%
45-54 years 5.1%
35-44 years 12.3%
25-34 years 39.1%
18-24 years 39.5%
Gender
Male (47.8%)
Female (52.2%)
Household income
Less than $25,000 32.1%
$25,000 to $39,999 9.3%
$40,000 to $59,999 14.7%
$60,000 to $74,999 8.4%
$75,000 to $99,999 8.2%
$100,000 to $149,999 27.3%
$150,000 and above %
OS
Android (39.6%)
iOS (60.4%)
Leading carriers
01 T-Mobile
02 Verizon
03 T-Mobile
5 most visited places/venues
01 Triangle Park
02 Joe Cole
03 Kennedy
04 Meridian Hill Park
05 Fort Chaplin Park
Updated: 11-2024