
This post was written by Lior Ben Zvi Svinik, Algo Team Leader at Start.io.
In this article, we explore one of the most persistent and under-discussed challenges in AdTech data platforms: the long tail. We start by explaining the phenomenon and why extreme sparsity naturally emerges at scale, then dive into its statistical and system-level root causes. From there, we analyze how long tail distorts measurement, experimentation, and learning often in ways that remain invisible to aggregate metrics. Finally, we outline practical mental models and algorithmic patterns for handling sparsity intentionally, treating long-tail performance as a measurable KPI rather than an afterthought.
Real‑time bidding systems process billions of auctions per day, generating terabytes of data every hour, all within millisecond‑level decision cycles. At Start.io, this scale becomes tangible: we analyze over 100 billion mobile data signals from hundreds of millions of users worldwide. Taking into consideration the number of device models, operating system versions, and the nature of the website or the mobile app leads to massive complexity
Behind the scenes, even a single ML pipeline can run many OCPUs with terabytes of RAM, demonstrating the level of computational power required to transform raw signals into meaningful insights. This is what “big data” truly looks like when you operate at a global AdTech scale, and why handling it isn’t a challenge but rather our competitive advantage.
If you work with data in AdTech, you are living in abundance.
Events stream relentlessly. Impressions, bids, clicks, conversions, post-backs, signals from dozens of dimensions: geo, device, app, publisher, seats, domains, user segments, time, prices, context. For analysts and data scientists, this is a dream playground. In a sea of complex data, valuable insights are everywhere. To bridge the gap between discovery and business impact, there is a need for intelligent aggregation. But, for anyone responsible for turning data into a product: models, decision systems, real-time pipelines, that same abundance quickly turns into a headache. How do you operate efficiently on this scale? How do you distinguish signals from noise? How do you build systems that adapt fast enough when the data distribution itself keeps changing?
In AdTech, the world does not stand still long enough for heavy retraining cycles. By the time your model converges, reality has already moved on. This is the daily duality of data science in AdTech: infinite opportunity on one side, constant instability on the other. And we live inside this tension every single day. This duality appears in many forms, but today we want to focus on one specific angle that we believe is still deeply underappreciated: The Long Tail.
From Observation to Action in Long-Tail Data
Why Long Tail Breaks Our Intuition?
Both humans and classical machine learning models rely on aggregation. We compress reality into manageable buckets so we can reason about it. Grouping users, publishers, apps, keywords, and domains is not laziness; it is survival. But what happens when the distribution has a very long tail? Sparse dimensions, rare combinations, entities with just a handful of observations (sometimes one, sometimes ten, sometimes a hundred) compared to millions in the “big body” of the data. Aggregation works because combining observations stabilizes estimates and accelerates learning; when groups contain only a few samples, variance dominates the signal, making conclusions unreliable or even misleading.
The naive solutions are tempting. Merge the entire tail into a single bucket and assume homogeneous behavior. Ignore it altogether and focus where volume is guaranteed. Or worse: react aggressively to a single lucky (or unlucky) sample. These approaches may be convenient, but they will never lead to excellence.
What makes the long tail especially dangerous is that it ״looks״ negligible. Each individual segment appears too small to matter, which makes it easy, almost natural, to flatten it mentally or push it aside entirely. But this is an illusion. While each tail entity is small on its own, the tail accumulates. When you sum up its relative contribution across thousands or millions of such entities, it often represents a substantial, sometimes dominant, share of the system’s activity.
This is the mental shift that changes everything. The long tail does not behave like the head, yet it cannot be treated as marginal. Today’s tail is frequently tomorrow’s growth engine: new publishers, emerging geographies, novel apps, and evolving user behaviors all start there. Manage the tail well, and you unlock massive business value. Neglect it, and you systematically bias your systems toward the past.
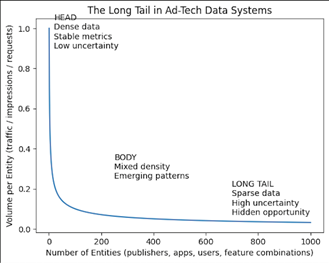
Figure: The Long Tail in AdTech Data Systems
A small head of high-volume entities dominates individual metrics, while a vast long tail of sparse entities accumulates into significant system-level impact. Treating the long tail explicitly, rather than averaging it away, is critical for learning, exploration, and long-term growth.
This is not a niche problem! Analysts, BI developers, data scientists, ML engineers, and decision-makers all face it: just at different levels of abstraction. And once you truly internalize how much power is hiding in the accumulated tail, you will never look at your data the same way again.
Long Tail as a KPI, not a Side Effect
Here is the core idea we want you to take away: Treat your performance on the long tail as a first-class KPI. Not as noise. Not as an edge case. Measure it. Track it. Hold yourself accountable for it. Ask uncomfortable questions: How well do our models perform specifically on low-frequency entities? How much representation does the tail get relative to the head? Which dimensions are systematically under-sampled? Where are we starving exploration? Once teams start measuring these things explicitly, they are often shocked by what they find. Entire segments silently failing. Decisions made with false confidence. Systems that look great on average but collapse precisely where future opportunities live. And measurement is the catalyst. It forces new mechanisms, new mental models, and better decisions.
Long Tail as a KPI – Some Examples
I realize this concept can sound somewhat abstract and rightly so. “Long tail as a KPI” can be interpreted in many ways, and there are numerous applications we could dive into. Rather than covering them all, we want to ground the idea with a simple, practical example. What does it actually mean to treat the long tail as a KPI?
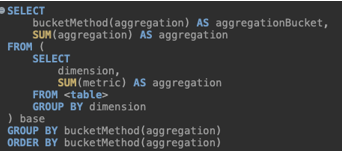
Assume we are running an A/B test for a new feature. Beyond looking at overall performance, one of the explicit questions we ask is: how does this feature perform on the long tail – in both test and control? That is the KPI. We do not inspect the tail only when something breaks; we monitor it continuously as part of the system’s health, and we evaluate it intentionally for every new feature or algorithmic change we introduce. To make this concrete, we first define what “tail” means through a measurable criterion. For example, entities with a low number of incoming requests. The pseudo-code below illustrates a simple aggregation that isolates the tail and compares its performance across variants. The resulting table summarizes how the tail behaves relative to the head, turning what is usually hidden inside averages into an explicit signal. From here, this analysis can branch in many directions (different dimensions, different metrics and so on), but the key shift is already made: the long tail is no longer an afterthought; it is something we actively measure, track, and optimize for.
Query Pseudo-Code:
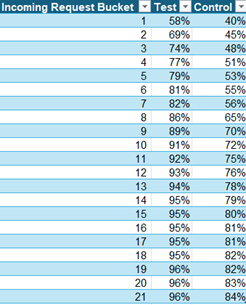
Output Example – Cumulative percentage of incoming requests
In the table below, you could find one example of displaying the tail as KPI:
buckets are ordered by sparsity, where Bucket 1 contains the sparsest entities (those with the lowest traffic and strongest long-tail characteristics) and higher bucket numbers represent increasingly dense segments. When comparing the two variants, we observe that the control group concentrates a larger share of activity in the denser buckets, while the test variant allocates relatively more traffic to the sparse end of the distribution. This shift means that the long tail receives more representation in the test. Importantly, this difference does not necessarily change global averages, which is why it would remain completely hidden if we only compared overall metrics. By explicitly analyzing sparsity buckets, we expose how each variant treats the long tail – turning distributional behavior into a measurable signal rather than an implicit side effect.
Statistical Realities of Sparsity
From a statistical perspective, the long tail is brutal. Variance explodes when sample sizes are small. A single conversion can swing an estimated rate by orders of magnitude. Classical estimators become unstable. Confidence intervals widen dramatically, if you bother computing them at all. Some useful tools and perspectives:
- Shrinkage and Bayesian priors reduce noise in sparse data by pulling extreme estimates toward a global or hierarchical mean, trusting individual behavior only as evidence accumulates. In practice, this means we assume tail entities behave like the population by default and only allow them to diverge once the data proves it with sufficient evidence.
- Credible intervals, not point estimates: decision-making based on uncertainty-aware metrics is vastly more robust. Instead of relying on a single estimated value, credible intervals explicitly capture the range of plausible outcomes, allowing decisions to account for uncertainty and avoid overconfidence, especially in sparse or volatile data regimes.
- Effective sample size (ESS) can be used as a proxy for how much independent information the data provides; gating decisions until sufficient evidence accumulates.
The key is not to eliminate uncertainty; it’s to model it explicitly and incorporate it into downstream decisions.
Exploration vs. Exploitation With Long Tail in Mind
Most ML practitioners are familiar with exploration vs. exploitation. Multi-armed bandits, epsilon-greedy policies, Thompson Sampling – these ideas are everywhere. A very common application in AdTech is throttling – traffic arrives, and the system must decide whether to process it or not. We want to exploit known high-performing dimensions, but we also need to explore. Now consider the long tail. If we do not sample small, seemingly unimportant dimensions enough, we will never discover their potential. But if we overreact to a single positive outcome, we might massively overestimate their value, only to be disappointed once we scale traffic. So the real question becomes: Have you listened enough?
Exploration is only meaningful if every sub-dimension gets sufficient representation. Otherwise, it is biased exploration. What Does “Sufficient” Mean? This is where things get nuanced. There is no universal answer; it depends on the business cost of mistakes, the volatility of the signal, and the speed at which the environment changes.
Some practical approaches:
- Power-based thresholds: Define sample sizes required to detect effects of interest with acceptable error.
- Adaptive confidence gating: Allow exploitation only once uncertainty drops below a threshold.
- Budgeted exploration: Allocate explicit exploration quotas to tail dimensions, independent of short-term performance.
- Relative exposure ratios: Track tail exposure vs. head exposure as a monitored metric.
The important part is not perfection – it’s awareness.
Simple Mechanisms That Go a Long Way
The good news: once you are aware of the problem, many solutions are surprisingly approachable. One example: oversampling methods in throttling algorithms. Instead of sampling traffic proportionally to volume, deliberately overweight underrepresented dimensions until they reach a minimum evidence threshold. This is not about fairness; it is about learning efficiency. Other patterns could be:
* Hierarchical modeling across dimensions
* Cold-start policies distinct from steady-state logic
* Decoupling learning traffic from revenue-maximizing traffic
* Explicit starvation detection alerts
None of these require exotic infrastructure. They require discipline and the willingness to admit that averages lie.
The Hidden Complexity of the Long Tail
Beyond sampling and measurement challenges, the long tail introduces a set of deeper, often unavoidable complexities. Some dimensions carry irreducible uncertainty: no matter how much data we collect, their behavior remains inherently volatile due to external factors, rapid churn, or non-stationary dynamics. This uncertainty becomes especially problematic during exploitation, where limited evidence can be mistaken for stable performance. The challenge is further amplified when considering fraud and adversarial behavior: low-volume, sparse dimensions are a natural hiding place for abuse, where signals are weak, detection is delayed, and false confidence can be costly. Finally, the long tail is not static. New entities continuously enter; others disappear, and distributions shift over time, meaning today’s head may drift into tomorrow’s tail and vice versa. This constant motion increases system complexity and demands solutions that are not only statistically sound, but also adaptive by design.
A Note on Engineering (and Why We are Skipping It)
There is also a deep engineering challenge here: how to represent sparse, high-cardinality data efficiently and serve decisions in real time. We have built some internal solutions, and there are fascinating tools in the market, addressing exactly this problem. But that is a full article on its own. For now, we want to emphasize that this is not just a modeling problem. It is an end-to-end data system design challenge. And it needs to be treated with the seriousness it deserves.
Closing Thoughts
The long tail is uncomfortable. It resists clean dashboards and stable metrics. It forces us to deal with uncertainty, humility, and delayed gratification. But it is also where differentiation lives. Teams that learn to treat sparsity as a KPI: measure it, reason about it, and design for it – consistently outperform those that optimize only for the obvious. So, the next time your system looks great “on average”, ask yourself: Where is the tail? How is it doing? And are we listening closely enough? Because in AdTech, the future rarely announces itself with volume.