
We are now in the era of 5G. In 2020, sales of 5G smartphones were forecast to reach 221 million units, accounting for 12% of all phone sales. And in 2021, that figure is expected to double again.
Although sales of 5G phones have been steadily rising in the past year or two, the development of infrastructure to support them has only just begun. And it’s a huge, costly job for carriers.
5G requires installation of an entirely new tower infrastructure. In addition, 5G towers have a very small range of approximately 300m, so cellular companies must invest in a high volume of towers in order to provide good coverage and reliable signals.
This is where Start.io data signals are proving invaluable.
Use Case: Mapping 5G users for better infrastructure planning
We recently worked with a French cellular carrier to help plan their tower infrastructure in the most efficient and accurate way. Using Start.io location data and user device information, we identified where the majority of location events with 5G-enabled devices were concentrated during a one-month period in France.
This enabled us to provide several powerful insights, such as the volume of users, events, and percentage of 5G device users among total mobile phone users at a particular location (lat/long).
Now, let’s see what the data actually looks like on the ground.
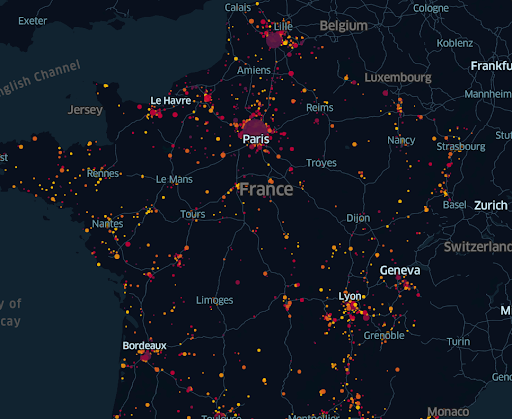
Visualization 1: The big picture
Each point on the chart below denotes a location where significant activity with 5G devices has occurred in France and beyond.
The size of the point varies by the volume of 5G device users, with the larger points denoting a higher number of users. The color of each point varies according to the percentage of 5G device users among total users at that location, with darker colors representing higher penetration.
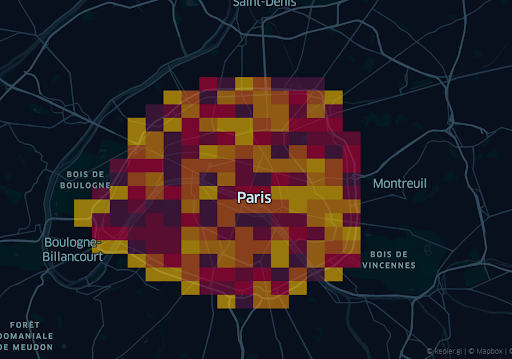
Visualization 2: Turn up the resolution for finer insights
We now restricted the analysis to the central area of Paris, which had the highest concentration of users. The area was divided into 600m squares for easier analysis. In this visualization map below, the color denotes the percentage of 5G device users among total users in each particular square.
Based on the data from these visualizations and more, we believe that the cell company should focus their infrastructure efforts on the areas that demonstrate high volume or proportions of users with 5G devices. Armed with this information, our client can maximize its deployment capital, and provide better coverage and value to its users, based on real-time, accurate user info on the ground.
Mobile data + location data = Powerful insights
Today, billions of people worldwide go about their daily business with a mobile phone in their pocket.
With the help of cutting-edge machine learning technology, mobile location data can be anonymized and analyzed, providing companies of all types with a powerful snapshot of where their customers are and what they are doing, at any given moment, while respecting user privacy and privacy laws.
This was the case for the French cellular carrier noted above, which used Start.io mobile location data to direct its infrastructure decisions on the ground. The recent rollout of 5G throughout Paris offers a very clear example of the power of mobile location data in action. And it’s the reason why carriers worldwide are showing interest in Start.io’s newest data capabilities to help create a 5G forward future.