
GameStop’s Stock Fluctuation
Looking at 12 months of data from Start.io indicates that GameStop’s stock fluctuation has little to do with its revenue and overall health, which has seen rises and falls in foot traffic more closely correlated with the COVID pandemic.
The everyday investor follows company financial reports and official statements to evaluate the stock price versus the current performance and outlook. High-end financial market players are using real-time business insight tools to better assess their portfolio’s business outcomes.
Given the fact that the last quarterly report of GameStop was released on December 8, 2020 and the full annual report was on March 27 2020, very early in the pandemic, it’s quite challenging to find any evidence that would show an economic factor supporting a clear investment decision right before the explosion.
The last few weeks have sent GameStop’s stock on a turbulent roller-coaster ride, with severe peaks and equally dramatic drops. Looking at 12 months of data from Start.io indicates that the company’s stock fluctuation has little to do with its performance, which has seen rises and falls in foot traffic more closely correlated with the COVID pandemic and may be influenced by the trend of moving to e-commerce.
Robinhood’s army that makes investments with the tips of their fingers are probably the same ones that are shifting to a fully online shopping experience.
GameStop Data Tells A Different Story
GameStop has 4,000+ brick and mortar stores spread across the US. To get a clearer picture of GameStop’s actual foot traffic and see if the hype was warranted, Start.io pulled historical data from its mobile data platform.
Below is Start.io’s data that charts the visit trends across all US-based retail stores during the last 12 months. What this shows is that the pandemic has had a tremendous impact on GameStop’s business. There is an upwards trend running from the end of December 2019 through January 2020, presumably due to holiday purchases.
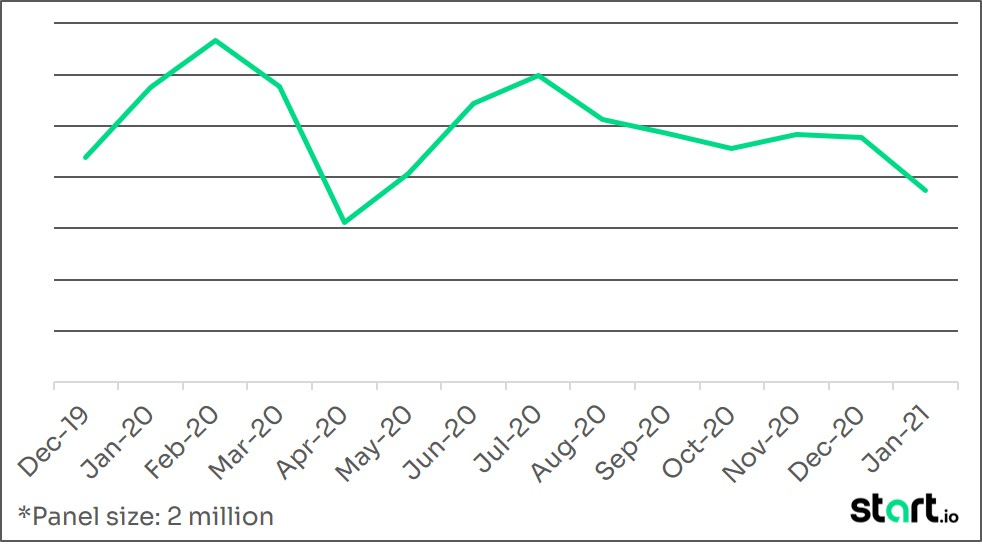
A significant decrease in traffic during March and April corresponds with pandemic-related stay-at-home orders as the virus started to ravage the country. There is a positive trend around June and July, due to many parts of the country opening up again, but the increase didn’t reach earlier numbers.
The fall and winter months display another negative trend that aligns with the later waves of retail being shut down in different US states. Clearly, what has had a real and lasting impact on GameStop is the continuous opening and closing of retail outlets.
There is a significant gap between what happened in the stock market and the reality on the ground. While there are aggressive moves on all fronts with high volatility in the stock market, the retail stores have been directly impacted by the pandemic yet are still attracting customers and traffic, not shutting their doors. As to whether GameStop’s stock is a strong investment opportunity, only time will tell.
Disclaimer: The information contained in this review is not intended as, and shall not be understood or construed as, an advice, analysis, recommendation, professional review or otherwise with respect to GameStop, including its performance, financials or securities, nor shall it be used for such purpose.
Start.io is not a broker or a dealer, nor an investment advisor, and does not have any access to non-public information about publicly traded companies, and this review is not a place for the giving or receiving of financial advice, advice concerning investment decisions or tax or legal advice.
This review is based on Start.io’s internal analysis of data available to Start.io throughout its medias and data platform. Start.io does not guaranty for the accuracy of this data.