Start.io audiences
Users Spending Between 35-50 Percent of Income on Rent
in Saint Paul
overview
People who pay 35-50% of their income towards rent share some similarities. 29.2% of the users in this group in Saint Paul are in the 55+ age group. Gain more insights about these users in the following charts.
Country
United States
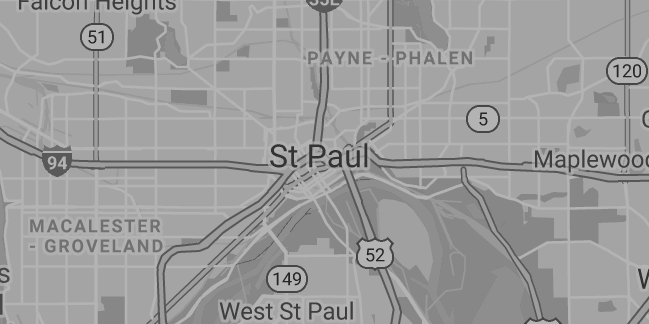
City
Saint Paul, Minnesota
Population
308,096
Area
52 sq mi
INSIGHTS ON Users Spending Between 35-50 Percent of Income on Rent in Saint Paul
Age
55 years and above 29.2%
45-54 years 22.3%
35-44 years 13.2%
25-34 years 14.3%
18-24 years 20.9%
Gender
Male (25.5%)
Female (74.5%)
Household income
Less than $25,000 37%
$25,000 to $39,999 26.1%
$40,000 to $59,999 15.4%
$60,000 to $74,999 3.3%
$75,000 to $99,999 6.6%
$100,000 to $149,999 11.3%
$150,000 and above 0.3%
OS
Android (71.8%)
iOS (28.2%)
Top devices
01 Apple iphone1,1
02 Apple iPad1,1
03 Samsung Galaxy A15 5G
04 Samsung Galaxy S23 Ultra
05 Samsung sm-s908u
Leading carriers
01 Verizon
02 T-Mobile
03 T-Mobile
5 most visited places/venues
01 Mississippi National River and Recreation Area
02 Duluth And Case Rec Center
03 Macalester College
04 North Commons Park
05 Longfellow Park
Updated: 07-2026