Start.io audiences
Vehicle Services Visitors
in Arizona

overview
Consumers who visit vehicle service centers need to have vehicle issues fixed or are interested in buying accessories for their vehicles. 32.8% of the users in this group in Arizona are in the 55+ age group. Gain more insights about Vehicle Services Visitors in the following charts.
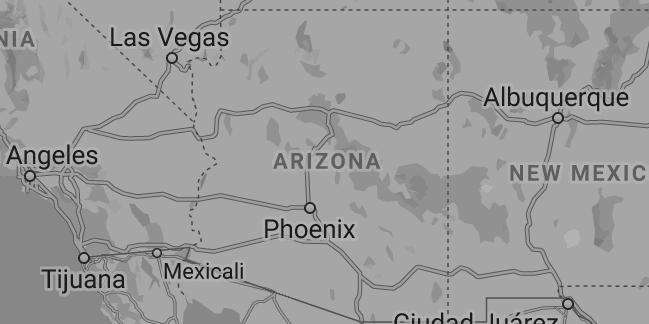
Country
United States
State
Arizona
Population
7,278,717
Area
113,594 sq mi
INSIGHTS ON Vehicle Services Visitors in Arizona
Age
55 years and above 32.8%
45-54 years 22.6%
35-44 years 15.7%
25-34 years 10.3%
18-24 years 18.7%
Gender
Male (27.8%)
Female (72.2%)
Household income
Less than $25,000 36.6%
$25,000 to $39,999 16.4%
$40,000 to $59,999 19.1%
$60,000 to $74,999 4.5%
$75,000 to $99,999 8.7%
$100,000 to $149,999 13.6%
$150,000 and above 1.1%
OS
Android (68.4%)
iOS (31.6%)
Top devices
01 Apple iphone1,1
02 Apple iPad1,1
03 Samsung Galaxy A15 5G
04 Samsung Galaxy S23 Ultra
05 Samsung Galaxy S24 Ultra
Leading carriers
01 Verizon
02 T-Mobile
03 AT&T
5 most visited places/venues
01 Arizona State University-Downtown Phoenix
02 Civic Space
03 Hoshoni
04 Desert West
05 Falcon
Updated: 07-2026