
Over the past six decades, Nike has built itself into one of the world’s most iconic brands, instantly recognized by its ‘Just Do It’ slogan and trademarked ‘swoosh’ logo. The company remains the world’s largest sportswear brand, pulling in more than double the annual revenue than its next-closest competitor, Adidas.
Nike remains dominant through innovative product development and marketing tactics, emotion-based messaging, celebrity endorsement deals, and sports sponsorships.
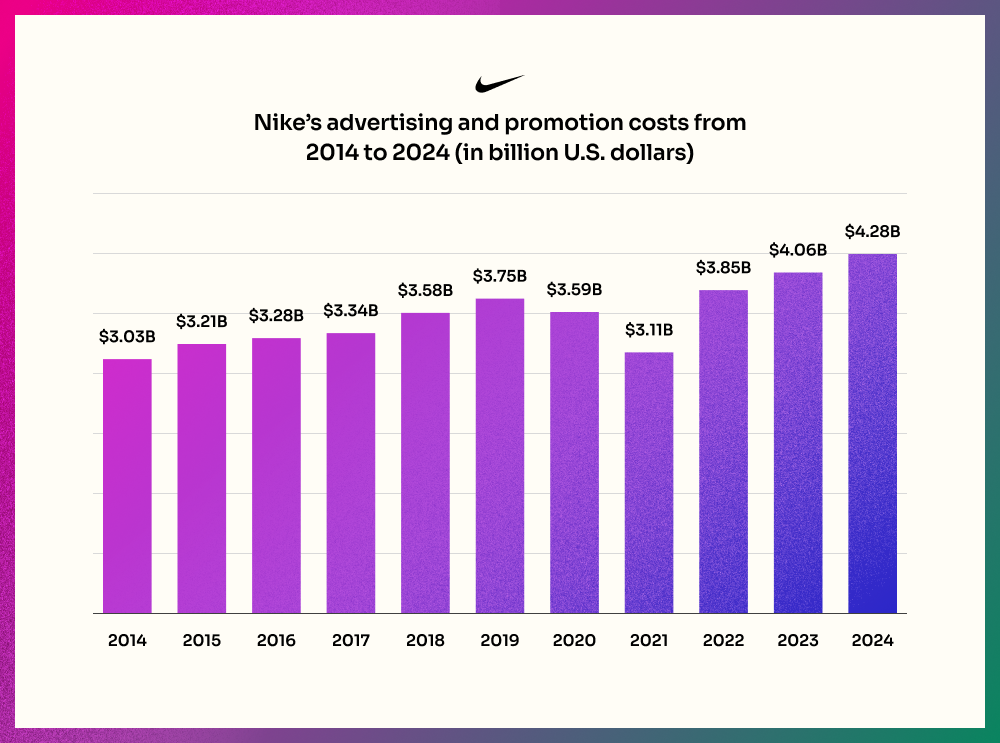
The brand also invests heavily in advertising. Since 2014, Nike has spent more than $3 billion per year on marketing and advertising, a catch-all category the company calls “demand creation.” In FY2024, Nike spent nearly $4.3 billion on marketing and advertising.
Source – Statista
By comparison, Adidas Group spent €2.5 billion Euros (roughly $2.7 billion USD) on marketing and point-of-sale expenses in FY2023.
Most of Nike’s ads don’t explicitly focus on a product; the Nike target audience responds most effectively to emotion-based advertising. This strategy helps create a brand image that reflects the aspirations of Nike customers, increase brand loyalty, brand engagement, and sales.
So, who is Nike’s target market? What are their aspirations, and how has the brand succeeded in building such a loyal fan base? Let’s begin with a Nike customer analysis and find out.
Who is the target market for Nike?
Nike sells its products worldwide, and has built products for every age and nearly every major sport. While Nike’s advertising focuses on athletes and weekend warriors, a “large percentage” of its products are worn for casual and leisure purposes, Nike said in its FY2023 annual report.
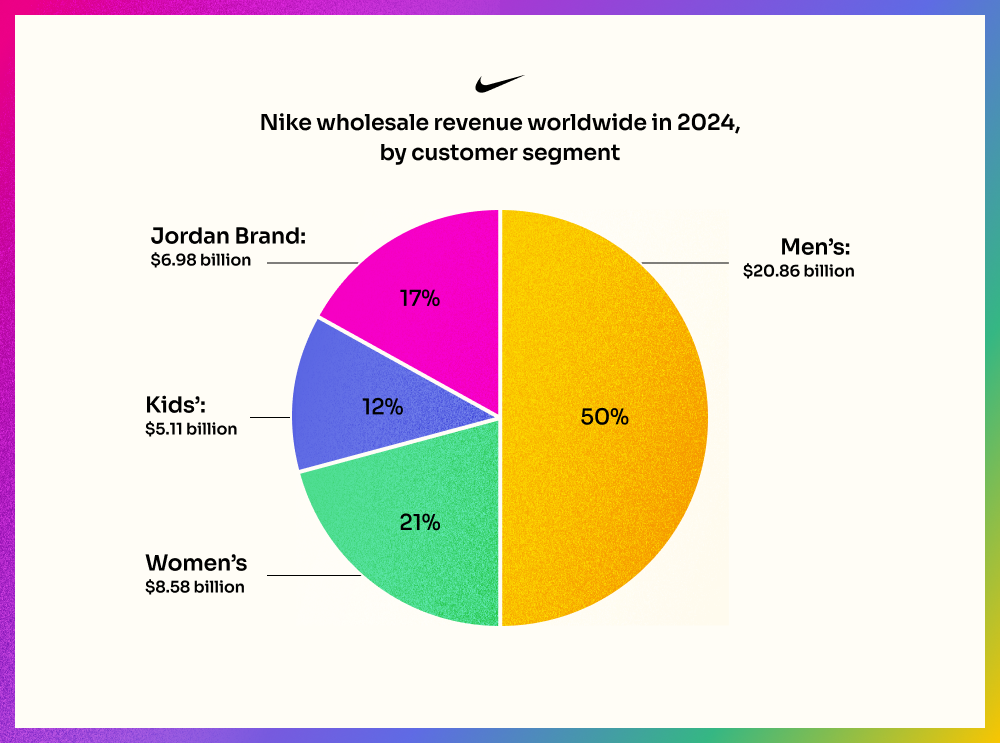
Men’s products outsell every other product category by a wide margin. In FY2024, men’s products made up a little over half of total wholesale revenue worldwide.
Source – Statista
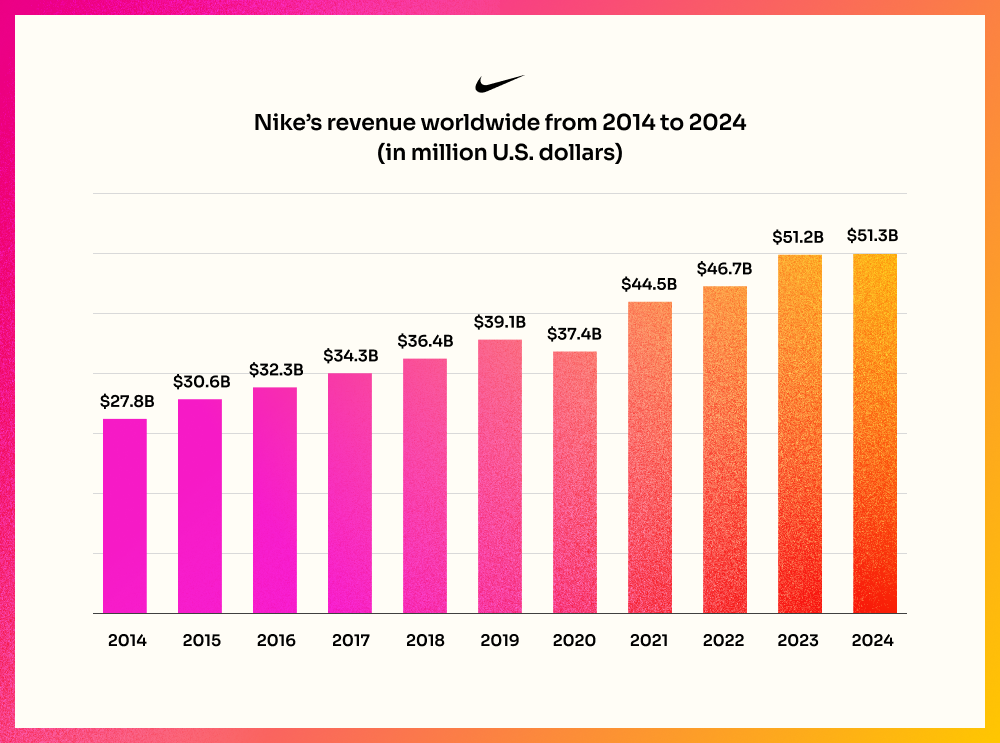
Nike positions itself as a brand for athletes but pulls every consumer into the fold with its fundamental pitch: if you have a body, you are an athlete. This has led to Nike’s outstanding financial success, generating more than $51 billion in worldwide sales in FY2024.
Source – Statista
Nike Target Market Segmentation and Marketing
The key component for any advertising or marketing strategy is a thorough customer segmentation, including demographic, geographic, behavioral, and psychographic attributes. Let’s explore the Nike target market profile from each of these viewpoints.
-
Nike Demographic Segmentation
Nike demographics include a wide range of users, aged roughly from 15 to 45 years. By spanning the generations, Nike taps middle-aged consumers who have disposable income and develops its relationship with younger audiences to ensure future growth and build life-long brand enthusiasts.
The company targets both male and female consumers, however, it continues to make significant investments in its women’s line, focusing on leggings, sports bras and ‘athleisure.’
Nike also strongly targets the youth demographic, noted as the favorite footwear and apparel brand for teens in 2024 in the US, according to analysts at Piper Sandler.
-
Nike Geographic Segmentation
The target market for Nike is located worldwide, mostly in urban centers. Nike consistently generates more revenue from North America than any other region.
In 2024:
- 5%, or $21.4 billion, of Nike’s revenue came from North America
- 6%, or $13.6 billion, of Nike’s revenue came from Europe
- 2%, or $7.5 billion, of Nike’s revenue came from Greater China
- 6%, or $6.7 billion, of Nike’s revenue came from Latin America and the Asia-Pacific region
-
Nike Behavioral Segmentation
The Nike target audience tends to be from the higher-income socio-economic group, reflected in the premium brand image and pricing of Nike products. The average Nike customer is a sports enthusiast, interested in leading an active and healthy lifestyle.
Besides the sporty behavioral traits of the Nike audience, they are also image-conscious and tech savvy, looking to be ahead of the trends and up-to-date with the latest in fitness fashion and footwear technology.
-
Nike Psychographic Segmentation
As part of a strategy to widen its target market, Nike often focuses on breakout psychographic segments. These include ‘weekend runners’, who enjoy keeping fit on weekends and even training for a half marathon, and ‘style shoppers’, 20-something women who want to wear the latest sports fashion trends before, during and after workouts.
All Nike consumer segments are made up of ‘aspirers’ and ‘succeeders’, people who are motivated to be fit and stay on trend.
-
Nike Marketing Strategy
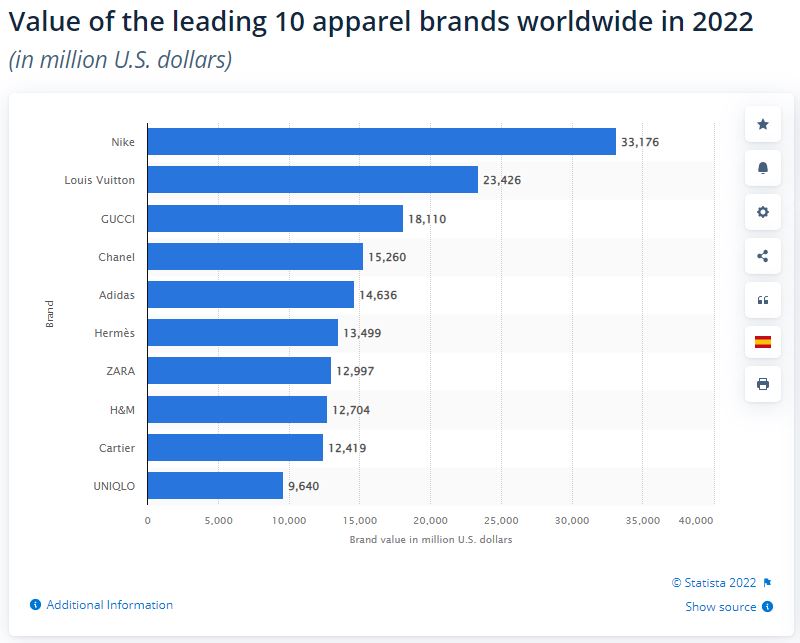
Beyond the sports clothing and footwear market, Nike is estimated to be the world’s most valuable apparel brand, with a brand value of $42.5 billion in 2023, according to the FashionUnited Index of Most Recognized Fashion Brands.
When considering how to create a successful marketing strategy, look no further than Nike.
The STP of Nike informs a wide-ranging set of marketing goals and objectives. For example, Nike leverages behavioral segmentation to build brand affinity and loyalty with consumers.
This can be seen in their personalized email and social media campaigns. When people engage with and show ongoing interest in the brand on any platform, Nike retargets them on other channels.
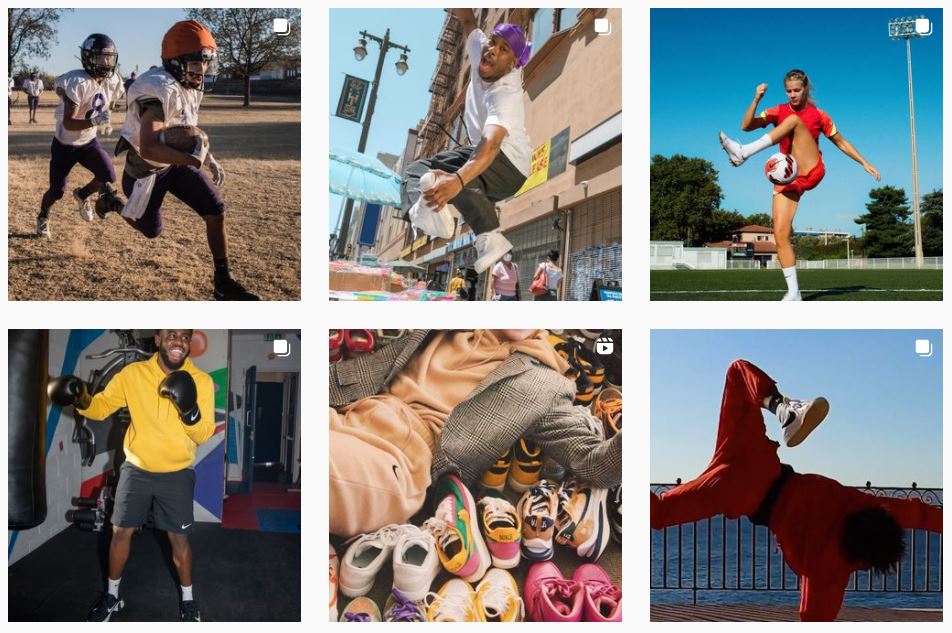
Here’s a look at how they connect with the two most dominant age groups (18-24 and 25-34) on Instagram:
Although Nike targets a global audience, it uses geographic segmentation for its product lines and marketing campaigns, adapting for local cultural and weather trends that impact consumer behavior. For example, the brand’s warmest winter items aren’t available in countries with more moderate temperatures.
Another example of how the brand connects with different geographic regions can be seen in the athletes featured in ad campaigns. In the US, for example, the Nike “Stopocalypse” ad features American sportspeople and celebrities, such as Kobe Bryant, Kevin Hart and Simone Biles:
In the UK, the well-received ‘Nothing Beats a Londoner’ campaign targeted the hyper-local London youth market, featuring upcoming London athletes and real-life citizens.
The campaign combined user-generated social media content, local events, swag and more, to encourage young audiences to become involved in sports and realize their potential.
Product innovation and a show-stopping approach to marketing sets the Nike brand apart from the competition in all regions. Check out the remarkable OOH 3D billboard promoting Nike Air Max in Japan:
The Nike company markets at a grass-roots level with a wide range of corporate responsibility programs and charitable activities. In FY2023, Nike contributed $142.7 million toward community investment, including women’s empowerment, sustainability and diversity initiatives.
Sports Enthusiasts in United States
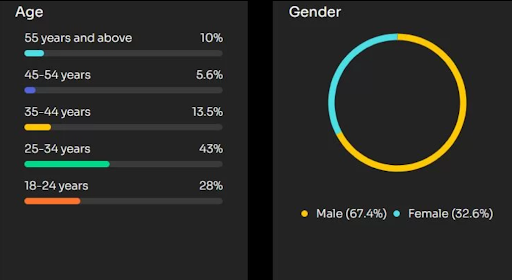
US-based consumers who fall into the Sports Enthusiasts category share many of the traits of the Nike target market. Like Nike, the demographics represent both sexes, with men outranking women 67% to 33%.
The Nike target market age group is also similar to the Sports Enthusiasts segment, of which 84.5% of consumers are between 18 and 44.
Although Nike hasn’t released data around its device targeting segmentation, Start.io insights reveal that among consumers identified as Sports or Running Enthusiasts, there is an overwhelming preference for Android devices.
For a marketing campaign to be successful, it must reach the right audiences. For companies marketing to sports enthusiasts, understanding the Nike target audience is a big step in fine-tuning campaign messaging and targeting to get the best results.
For these kinds of data-driven insights for Sports Enthusiasts, Runners, and 500+ other consumer segments and audience locations around the world, visit the Consumer Insights and Audiences Hub.
Nike FAQs
What demographic buys the most sneakers?
Data shows that the target market for Nike shoes includes Millennials (24–39-year-olds) and Gen Z (9–24-year-olds). Presumably, many Millennials are buying sneakers for their young children. Men still buy more sneakers than women, but the gap is closing.
What demographic buys the most Nike products?
Consumers between the ages of 15-40 buy the most Nike products, including sneakers, apparel, and sporting goods.
Who is Nike's competition?
Nike’s biggest competitor is Adidas, but others include Asics, Puna, Under Armour, Fila, New Balance, and Sketchers. In terms of athletic apparel, Nike’s competition includes Lululemon, Athletica, and VF Corporation.
Who makes more sales Nike or Adidas?
Nike generates more sales than Adidas. In 2020, Nike was valued at $34.4 billion, while Adidas was valued at $12.07 billion.
How to define the year that was 2021: Corona Light? The year we learned to live with COVID? The second year of the pandemic?
Whichever name you prefer, it is clear that 2021 was a kind of transition year. The initial shock of the pandemic gave way to a hybrid blend of ‘normal’ life and social distancing. Once again, there was a shift in consumer behavior and this is reflected in Start.io mobile audience data, covering hundreds of consumer segments and the entire globe.
We’ve pinpointed several key segments with notable data shifts that may impact your mobile advertising strategy in 2022. Here are the consumer behavior trends worth keeping an eye on as you kick off a new year and new marketing plan:
Baking and cooking
According to a survey about hobbies during coronavirus, 21% said that they turned to baking in their extra time at home, perhaps because it provides an opportunity to get away from screens and enjoy a wholesome family activity. This is reflected in mobile app usage, with a 16% jump in the usage of baking and cooking related apps in 2021 compared to 2020.
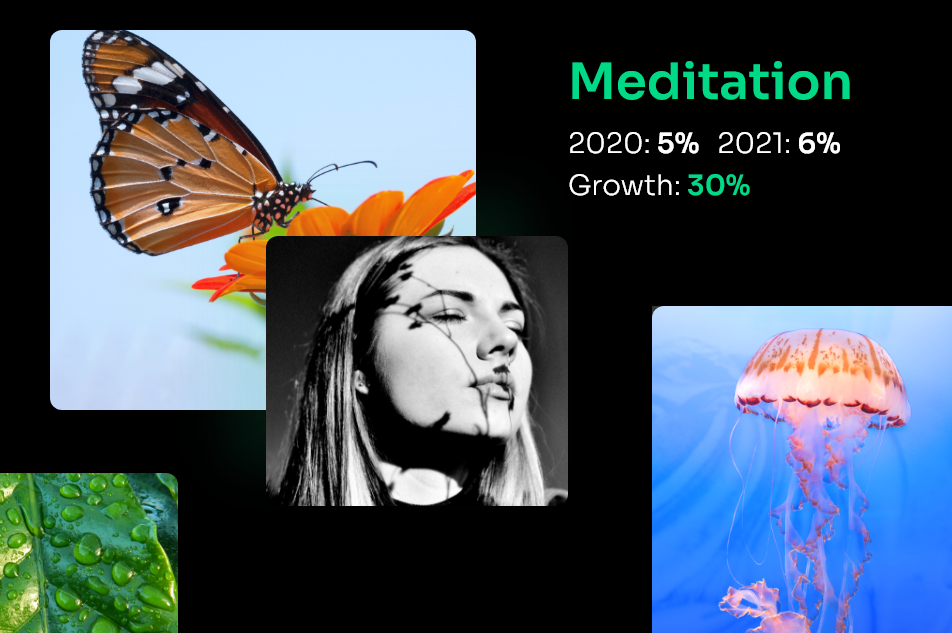
Meditation
The stress of the pandemic has taken its toll. According to the CDC, between August 2020 and February 2021, the US population saw an approximate 5% increase of symptoms of mental health issues (36.4% to 41.5%). It’s no wonder that people are turning to apps and tools to help improve their state of mind. This year saw an increase of 30% in use of meditation apps, definitely pointing to the need among global audiences.
DIY
DIY saw a huge boom during the pandemic, with 25% of DIY fans saying this was due to “finally having the time for it”. This is reflected in mobile audience data too, with a doubling of the number of users interested in DIY apps, from 4% to 8%. With more time at home, and more free time on their hands, DIYers have been taking advantage and will continue to do so as long as it is convenient.
News
After two years of non-stop pandemic news, you might think that people are feeling “news fatigue”, but actually more people are using apps to get their news than ever before. In 2021, there was an increase in 12% of news app usage, showing that people simply can’t get enough of the news and staying connected to what’s going on is still vitally important.

Dating
COVID rules made dating very difficult. In fact, the post-pandemic world has given rise to a new trend: FODA, or fear of dating again! Even so, there’s no stopping love, and dating apps are seeing an uptick, with an overall increase of 30% in usage, from 18% in 2020 to 24% in 2021.
Careers and employment
The Great Resignation is well underway, and people are changing jobs or considering a change in higher numbers than ever before. This is reflected in mobile app usage around careers and employment, with a 27% jump (from 9% in 2020 to 11% in 2021), as people use this time to re-think their aspirations and shift their career path.
Wedding planning
Weddings took a big hit during the pandemic. In spring 2021, it was reported that 7000 weddings in England were being cancelled due to confusion surrounding lockdowns and social distancing rules. As the world opens up, couples don’t want to wait any more, and this can be seen in the 57% increase in usage of wedding related apps in 2021 compared to 2020.
VPN
Work from home was a key characteristic in 2020, and it continued big time into 2021. This was noted in mobile audience data that showed a 101% increase in VPN use, jumping from 17% in 2020 to 35% in 2021. Expect this to continue into 2022, as 61% of remote workers say they will be working in hybrid mode in the future, with 27% saying they will work from home full time.
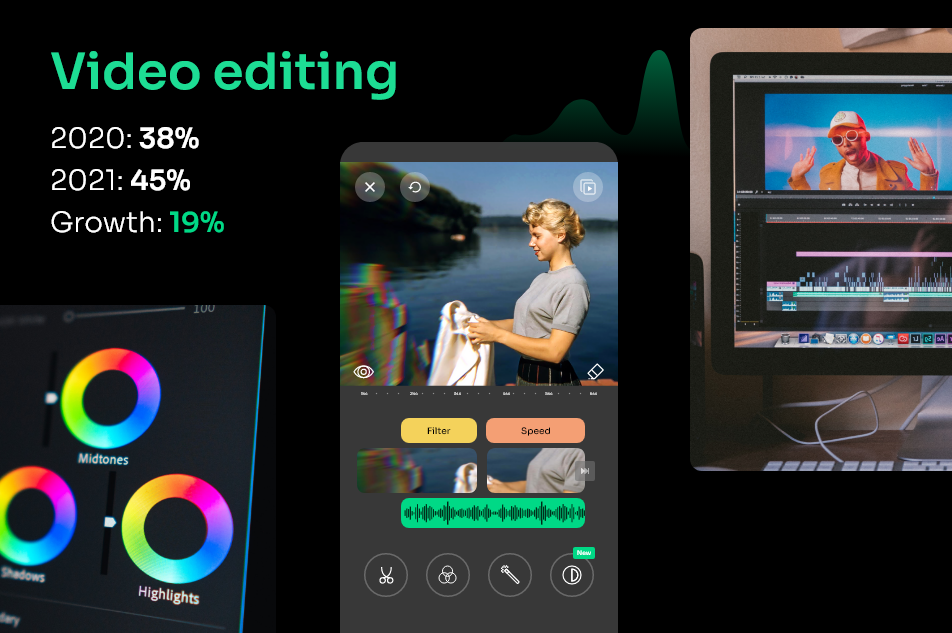
Video editing
With more work from home, less time spent commuting, and less going out to socialize and for leisure, people are turning to other creative outlets and interests, especially those that can be done at home and on computer. Video editing was a big one this past year, with a 19% increase of mobile audience interest, from 38% in 2020 to 45% in 2021.
Mobile audience data: the key to success in 2022
Mobile app usage is on the rise, and during the pandemic, it was nothing less than a boom. In the business segment, for instance, there was a 220% increase in app usage. The tricky part is getting behind these awesome numbers to analyze the trends and understand what’s really going on across all consumer segments. In light of this, what will the new year look like for mobile users and marketers?
2022 kicked off with the Omicron variant raging around the world, governments working hard to increase vaccination rates, some countries returning to lockdowns, continued social distancing, and a lot of uncertainty among consumers about how to behave. This kind of confusion can expect to give rise to continued use of mobile apps in most segments.
On the other hand, many consumers are experiencing “pandemic fatigue”, with a longing to return to in-person shopping, gym visits, working at the office rather than at home, concerts, vacations, leisure experiences and more. It is clear that 2022 is not simply a case of “2020-too”, but rather the beginning of the return to pre-pandemic life, intertwined with the deeply ingrained, new habits of a hybrid lifestyle that blends online and offline experiences like never before.
With the help of Start.io data gathered from half a million integrated apps and 30 billion SDK downloads, you can gain accurate, powerful insights about audience behavior and drive smarter mobile advertising in 2022. To dig deep into mobile data for your target audience, in hundreds of consumer segments and locations, visit the Start.io Audience hub, or read our recent blog post on Demographic Audience Analysis.
Food. It’s no longer just a source of fuel and nutrition for the body. In recent years, it has become a powerful and competitive consumer segment.
In 2019, a US study found that over 50% of consumers considered themselves “foodies”. More than 60% said they would go to an event just for the food, and 26% had shared a food snapshot on social media in the previous month.
There are entire communities of foodies all over the world who are thinking about food, preparing food, browsing online and offline for food and related items, cooking at home, or dining out. In this blog, we’re going to explore home delivery food trends, what that means for food businesses, and how mobile user data can illuminate food delivery app customer segmentation and advertising strategies for marketers and app publishers in the niche.
The rise of food delivery apps
When COVID hit, the food industry was faced with a dilemma and a challenge.
On the one hand, restaurants had to comply with lockdown orders and social distancing rules, and that meant a severe drop in business. On the other hand, consumers were more focused on food than ever – they became more interested in the kitchen and home cooking, and increased their takeaway purchases too.
These changes to online food ordering trends are so far here to stay. In fact, one in five survey respondents say they are enjoying more takeaway food now than before the pandemic.
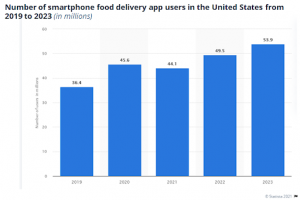
In all these rapidly changing trends and habits, food companies have had to adapt quickly, and restaurants in particular are looking for ways to bounce back and restore their business activity to pre-pandemic levels. One way to catch audience attention and boost restaurant orders is with food delivery apps, which are steadily growing in popularity as the graph below clearly shows.
Food delivery app users: No longer just a niche segment
Food delivery apps were once a niche market, mainly serving the more mobile-savvy and tech-native Gen Z and millennials. However, when faced with lockdowns, restaurants all over the world took to food delivery apps as a way to grab the target audience’s attention, continue to serve customers and increase business opportunities.
This is evident in the success of Uber Eats, an offshoot of the ride-sharing company. During shelter-in-place orders, when ride sharing demand was way down, Uber Eats generated $4.8 billion in revenue from food deliveries, representing over 40% of Uber’s business.
Another way that restaurants have been innovating during this time is the establishment of “ghost kitchens” – kitchens set up for the sole purpose of food delivery, with no in-house restaurant seating. Ghost kitchens are an excellent solution, but they are costly to run, and they come with critical issues of operational viability and scalability.
Before investing in a ghost kitchen, business owners must ask themselves, where is the best location that will serve the largest number of consumers? Where are the foodies located, what kind of service are they looking for, and how can my business provide it? Read on to see how Start.io data insights can help food delivery companies answer these questions.
Foodies in Boston vs LA: A Start.io case study
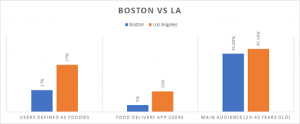
Analysis of Start.io data in Boston and Los Angeles helps paint an accurate picture of the characteristics and behaviors of local foodies.
Both cities are home to big communities of foodies, who love dining out and in, however Los Angeles is the definite leader, with 37% of mobile users defined as foodies in LA, compared to 17% foodies in Boston. This is reflected in the activity seen on food delivery apps too. In LA, 16% of users actively order food via their mobile devices, with just 5% doing the same in Boston.
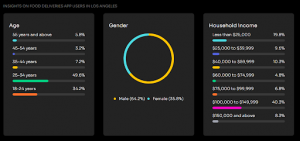
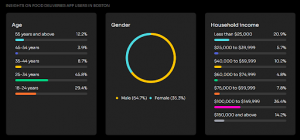
There are similarities between the cities too. In both Boston and LA, affluent consumers are the ones who most use food delivery apps, with over 50% earning $75K or more annually. The younger adult age group of 25-34 year olds is by far the biggest audience, with 49.06% in LA and 45.08% in Boston, and in both cities, men are the majority of food app users, with just over 64% user share.
Interestingly, despite that LA is a more food app-centric market overall, there are in fact over 20,000 mobile users displaying the potential to become food delivery app users in Boston.
What’s next for food delivery app publishers?
The global pandemic of 2020 continues to reverberate its impact on businesses, and for food providers, it has been a game changer. As time passes, people become even more accustomed to the convenience and speed of food delivery apps and home delivery trends continue. Having a grasp of up-to-date consumer data for this user segment is crucial to know what steps to take next.
For example, according to Start.io data in the US, the majority of food delivery app customer segmentation is young millennials with a strong male majority. This audience is tech savvy and fast to adapt to market and technology changes. They are also impatient, and interested in new innovations.
In addition, the past year has seen constant growth in food delivery app users over the age of 40. With the right marketing messaging and effective targeting, food app publishers can reach this growing audience and leverage a valuable potential revenue stream.
Online food ordering trends: All you need to know
This Start.io data, and more like it, is a powerful way for food businesses and restaurant owners to identify the best target audience for food delivery in different locations. Then, they can make more accurate and financially viable decisions about things like ghost kitchen set-up and food delivery operations.
With the launch of the Start.io Audience Segments hub, insights like these are available for 500+ consumer segments in every niche, from food to finance, travel to teens, beauty shoppers to burger lovers. This up-to-date mobile user data covering hundreds of locations worldwide, accessible instantly via a simple search console.
Be sure to check in to Start.io Audiences Hub and start taking advantage of data to boost your performance in the food delivery app and online food ordering segment.
We are now in the era of 5G. In 2020, sales of 5G smartphones were forecast to reach 221 million units, accounting for 12% of all phone sales. And in 2021, that figure is expected to double again.
Although sales of 5G phones have been steadily rising in the past year or two, the development of infrastructure to support them has only just begun. And it’s a huge, costly job for carriers.
5G requires installation of an entirely new tower infrastructure. In addition, 5G towers have a very small range of approximately 300m, so cellular companies must invest in a high volume of towers in order to provide good coverage and reliable signals.
This is where Start.io data signals are proving invaluable.
Use Case: Mapping 5G users for better infrastructure planning
We recently worked with a French cellular carrier to help plan their tower infrastructure in the most efficient and accurate way. Using Start.io location data and user device information, we identified where the majority of location events with 5G-enabled devices were concentrated during a one-month period in France.
This enabled us to provide several powerful insights, such as the volume of users, events, and percentage of 5G device users among total mobile phone users at a particular location (lat/long).
Now, let’s see what the data actually looks like on the ground.
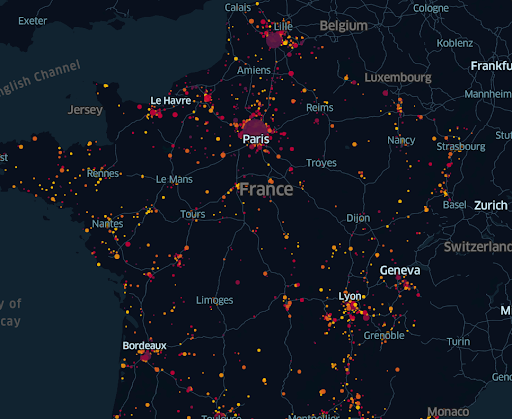
Visualization 1: The big picture
Each point on the chart below denotes a location where significant activity with 5G devices has occurred in France and beyond.
The size of the point varies by the volume of 5G device users, with the larger points denoting a higher number of users. The color of each point varies according to the percentage of 5G device users among total users at that location, with darker colors representing higher penetration.
Visualization 2: Turn up the resolution for finer insights
We now restricted the analysis to the central area of Paris, which had the highest concentration of users. The area was divided into 600m squares for easier analysis. In this visualization map below, the color denotes the percentage of 5G device users among total users in each particular square.
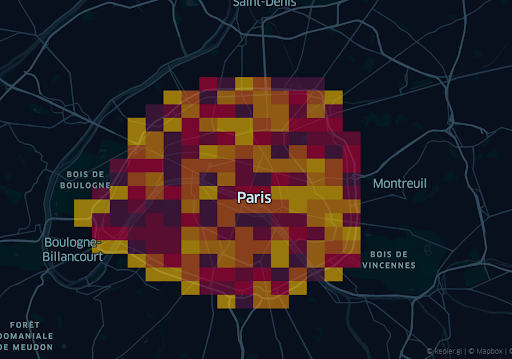
Based on the data from these visualizations and more, we believe that the cell company should focus their infrastructure efforts on the areas that demonstrate high volume or proportions of users with 5G devices. Armed with this information, our client can maximize its deployment capital, and provide better coverage and value to its users, based on real-time, accurate user info on the ground.
Mobile data + location data = Powerful insights
Today, billions of people worldwide go about their daily business with a mobile phone in their pocket.
With the help of cutting-edge machine learning technology, mobile location data can be anonymized and analyzed, providing companies of all types with a powerful snapshot of where their customers are and what they are doing, at any given moment, while respecting user privacy and privacy laws.
This was the case for the French cellular carrier noted above, which used Start.io mobile location data to direct its infrastructure decisions on the ground. The recent rollout of 5G throughout Paris offers a very clear example of the power of mobile location data in action. And it’s the reason why carriers worldwide are showing interest in Start.io’s newest data capabilities to help create a 5G forward future.