Start.io audiences
Democratic voters
in Arizona

overview
These statistics show insights and characteristics for Americans who are likely to vote for candidates in the Democratic party. Based on mobile apps, location, and various mobile data signals, when it comes to Democratic voters in Arizona, 65.9% are males.


Country
United States
State
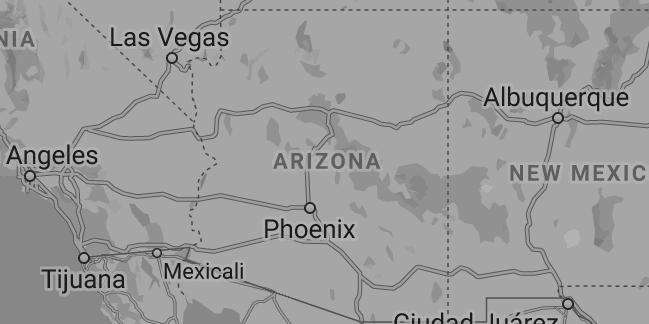
Arizona
Population
7,278,717
Area
113,594 sq mi

INSIGHTS ON Democratic voters in Arizona
Age
55 years and above 20.6%
45-54 years 3.9%
35-44 years 6.5%
25-34 years 15.2%
18-24 years 53.8%
Gender
Male (65.9%)
Female (34.1%)
Household income
Less than $25,000 34.8%
$25,000 to $39,999 16.4%
$40,000 to $59,999 18.7%
$60,000 to $74,999 6.9%
$75,000 to $99,999 9.6%
$100,000 to $149,999 13.6%
$150,000 and above %
Top devices
01 Samsung Galaxy S9
02 Samsung Galaxy S10
03 Samsung Galaxy S10+
04 Samsung Galaxy S10e
05 Samsung Galaxy Note9
Leading carriers
01 Verizon
02 T-Mobile
03 AT&T
5 most visited places/venues
01 Walmart Supercenter
02 Western Union
03 Starbucks
04 Phoenix Sky Harbor International Airport
05 Fry's Food & Drug Stores
Updated: 08-2022