
Over the past six decades, Nike has built itself into one of the world’s most iconic brands, instantly recognized by its ‘Just Do It’ slogan and trademarked ‘swoosh’ logo. The company remains the world’s largest sportswear brand, pulling in more than double the annual revenue than its next-closest competitor, Adidas.
Nike remains dominant through innovative product development and marketing tactics, emotion-based messaging, celebrity endorsement deals, and sports sponsorships.
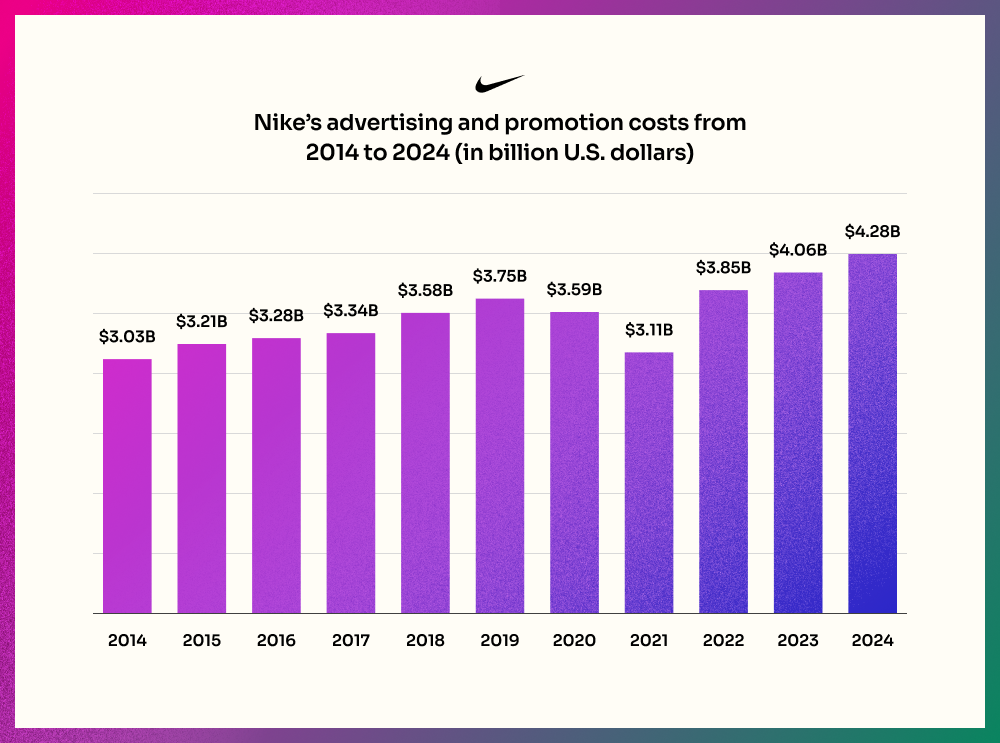
The brand also invests heavily in advertising. Since 2014, Nike has spent more than $3 billion per year on marketing and advertising, a catch-all category the company calls “demand creation.” In FY2024, Nike spent nearly $4.3 billion on marketing and advertising.
Source – Statista
By comparison, Adidas Group spent €2.5 billion Euros (roughly $2.7 billion USD) on marketing and point-of-sale expenses in FY2023.
Most of Nike’s ads don’t explicitly focus on a product; the Nike target audience responds most effectively to emotion-based advertising. This strategy helps create a brand image that reflects the aspirations of Nike customers, increase brand loyalty, brand engagement, and sales.
So, who is Nike’s target market? What are their aspirations, and how has the brand succeeded in building such a loyal fan base? Let’s begin with a Nike customer analysis and find out.
Who is the target market for Nike?
Nike sells its products worldwide, and has built products for every age and nearly every major sport. While Nike’s advertising focuses on athletes and weekend warriors, a “large percentage” of its products are worn for casual and leisure purposes, Nike said in its FY2023 annual report.
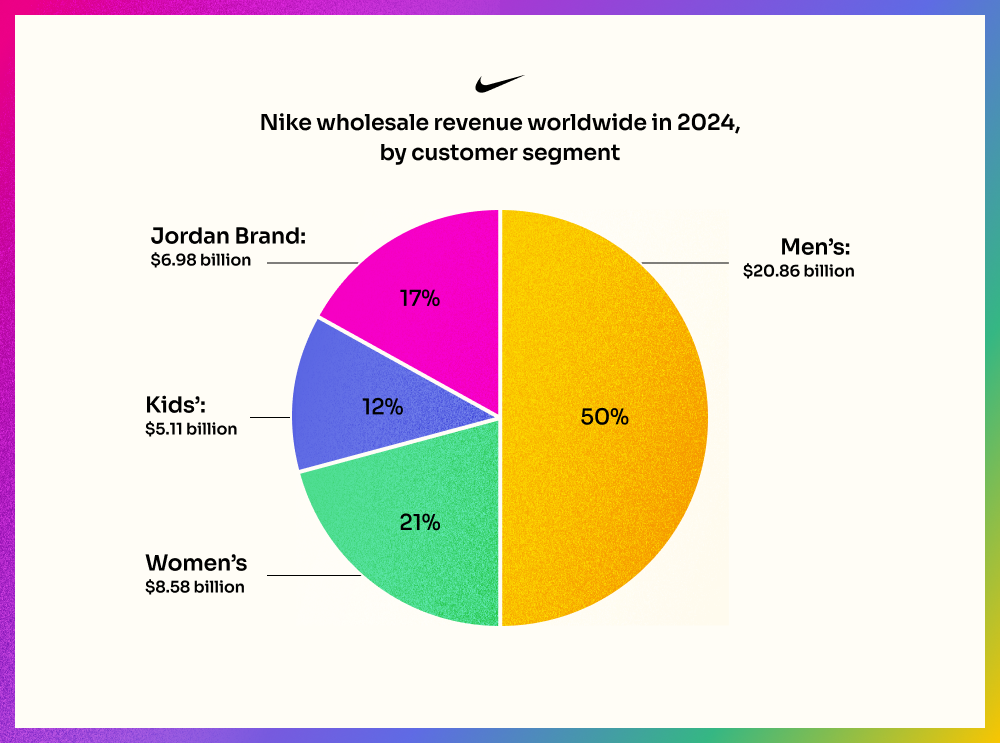
Men’s products outsell every other product category by a wide margin. In FY2024, men’s products made up a little over half of total wholesale revenue worldwide.
Source – Statista
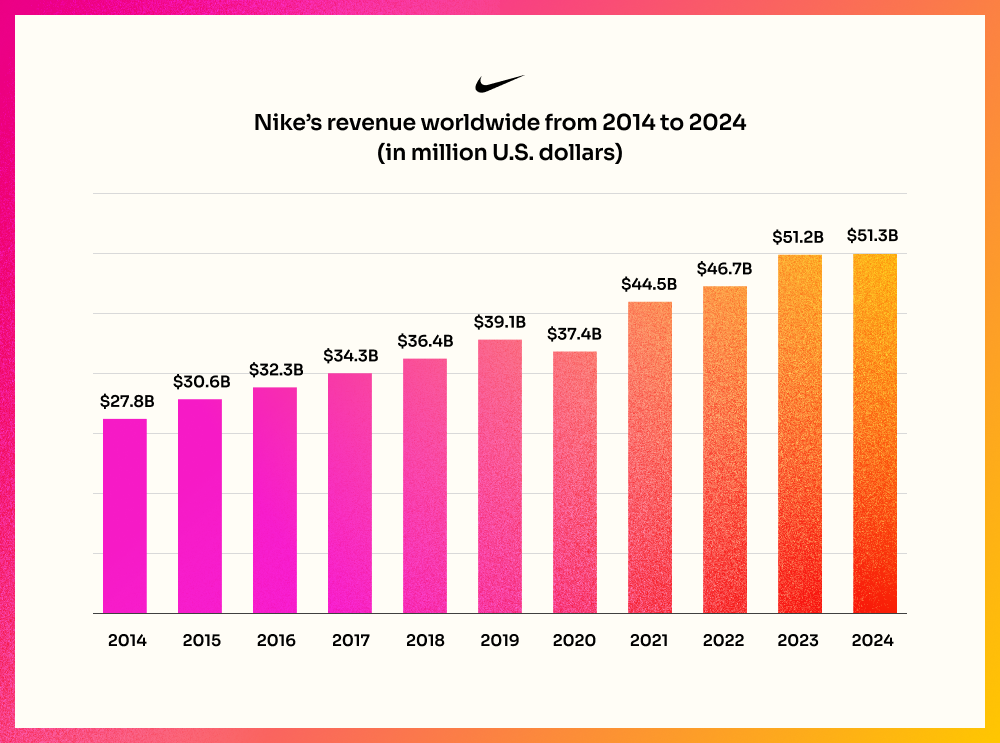
Nike positions itself as a brand for athletes but pulls every consumer into the fold with its fundamental pitch: if you have a body, you are an athlete. This has led to Nike’s outstanding financial success, generating more than $51 billion in worldwide sales in FY2024.
Source – Statista
Nike Target Market Segmentation and Marketing
The key component for any advertising or marketing strategy is a thorough customer segmentation, including demographic, geographic, behavioral, and psychographic attributes. Let’s explore the Nike target market profile from each of these viewpoints.
-
Nike Demographic Segmentation
Nike demographics include a wide range of users, aged roughly from 15 to 45 years. By spanning the generations, Nike taps middle-aged consumers who have disposable income and develops its relationship with younger audiences to ensure future growth and build life-long brand enthusiasts.
The company targets both male and female consumers, however, it continues to make significant investments in its women’s line, focusing on leggings, sports bras and ‘athleisure.’
Nike also strongly targets the youth demographic, noted as the favorite footwear and apparel brand for teens in 2024 in the US, according to analysts at Piper Sandler.
-
Nike Geographic Segmentation
The target market for Nike is located worldwide, mostly in urban centers. Nike consistently generates more revenue from North America than any other region.
In 2024:
- 5%, or $21.4 billion, of Nike’s revenue came from North America
- 6%, or $13.6 billion, of Nike’s revenue came from Europe
- 2%, or $7.5 billion, of Nike’s revenue came from Greater China
- 6%, or $6.7 billion, of Nike’s revenue came from Latin America and the Asia-Pacific region
-
Nike Behavioral Segmentation
The Nike target audience tends to be from the higher-income socio-economic group, reflected in the premium brand image and pricing of Nike products. The average Nike customer is a sports enthusiast, interested in leading an active and healthy lifestyle.
Besides the sporty behavioral traits of the Nike audience, they are also image-conscious and tech savvy, looking to be ahead of the trends and up-to-date with the latest in fitness fashion and footwear technology.
-
Nike Psychographic Segmentation
As part of a strategy to widen its target market, Nike often focuses on breakout psychographic segments. These include ‘weekend runners’, who enjoy keeping fit on weekends and even training for a half marathon, and ‘style shoppers’, 20-something women who want to wear the latest sports fashion trends before, during and after workouts.
All Nike consumer segments are made up of ‘aspirers’ and ‘succeeders’, people who are motivated to be fit and stay on trend.
-
Nike Marketing Strategy
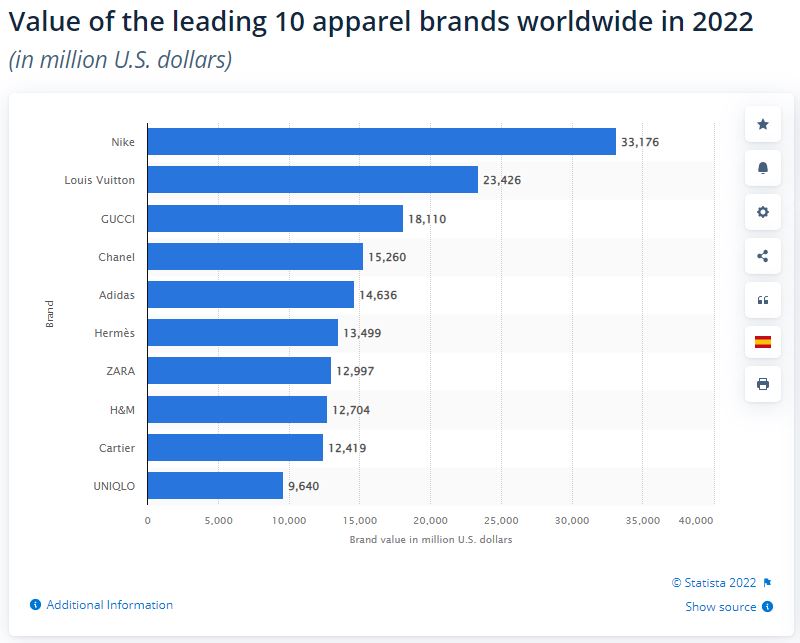
Beyond the sports clothing and footwear market, Nike is estimated to be the world’s most valuable apparel brand, with a brand value of $42.5 billion in 2023, according to the FashionUnited Index of Most Recognized Fashion Brands.
When considering how to create a successful marketing strategy, look no further than Nike.
The STP of Nike informs a wide-ranging set of marketing goals and objectives. For example, Nike leverages behavioral segmentation to build brand affinity and loyalty with consumers.
This can be seen in their personalized email and social media campaigns. When people engage with and show ongoing interest in the brand on any platform, Nike retargets them on other channels.
Here’s a look at how they connect with the two most dominant age groups (18-24 and 25-34) on Instagram:

Although Nike targets a global audience, it uses geographic segmentation for its product lines and marketing campaigns, adapting for local cultural and weather trends that impact consumer behavior. For example, the brand’s warmest winter items aren’t available in countries with more moderate temperatures.
Another example of how the brand connects with different geographic regions can be seen in the athletes featured in ad campaigns. In the US, for example, the Nike “Stopocalypse” ad features American sportspeople and celebrities, such as Kobe Bryant, Kevin Hart and Simone Biles:
In the UK, the well-received ‘Nothing Beats a Londoner’ campaign targeted the hyper-local London youth market, featuring upcoming London athletes and real-life citizens.
The campaign combined user-generated social media content, local events, swag and more, to encourage young audiences to become involved in sports and realize their potential.
Product innovation and a show-stopping approach to marketing sets the Nike brand apart from the competition in all regions. Check out the remarkable OOH 3D billboard promoting Nike Air Max in Japan:
The Nike company markets at a grass-roots level with a wide range of corporate responsibility programs and charitable activities. In FY2023, Nike contributed $142.7 million toward community investment, including women’s empowerment, sustainability and diversity initiatives.
Sports Enthusiasts in United States
US-based consumers who fall into the Sports Enthusiasts category share many of the traits of the Nike target market. Like Nike, the demographics represent both sexes, with men outranking women 67% to 33%.
The Nike target market age group is also similar to the Sports Enthusiasts segment, of which 84.5% of consumers are between 18 and 44.
Although Nike hasn’t released data around its device targeting segmentation, Start.io insights reveal that among consumers identified as Sports or Running Enthusiasts, there is an overwhelming preference for Android devices.
For a marketing campaign to be successful, it must reach the right audiences. For companies marketing to sports enthusiasts, understanding the Nike target audience is a big step in fine-tuning campaign messaging and targeting to get the best results.
For these kinds of data-driven insights for Sports Enthusiasts, Runners, and 500+ other consumer segments and audience locations around the world, visit the Consumer Insights and Audiences Hub.
Nike FAQs
What demographic buys the most sneakers?
Data shows that the target market for Nike shoes includes Millennials (24–39-year-olds) and Gen Z (9–24-year-olds). Presumably, many Millennials are buying sneakers for their young children. Men still buy more sneakers than women, but the gap is closing.
What demographic buys the most Nike products?
Consumers between the ages of 15-40 buy the most Nike products, including sneakers, apparel, and sporting goods.
Who is Nike's competition?
Nike’s biggest competitor is Adidas, but others include Asics, Puna, Under Armour, Fila, New Balance, and Sketchers. In terms of athletic apparel, Nike’s competition includes Lululemon, Athletica, and VF Corporation.
Who makes more sales Nike or Adidas?
Nike generates more sales than Adidas. In 2020, Nike was valued at $34.4 billion, while Adidas was valued at $12.07 billion.
Twenty five years ago, watching a movie at home involved heading out to a Blockbuster store and renting a DVD. Thanks to Netflix, which was established in 1997, that all changed, and Blockbuster? It’s been out of business since 2010.
Netflix began as a novel idea – instead of going out to rent a DVD, order it online and have it delivered to your door, for a mere $4 plus $2 postage. In the decades since, Netflix has become so much more than a DVD delivery company.
In 2007, it launched its famous video streaming service, and later began developing its own content in-house – a move which has paid off. In 2022, Netflix received more Academy Award nominations than any other movie distributor, beating out Disney, Warner Bros, MGM and all the leading Hollywood studios.
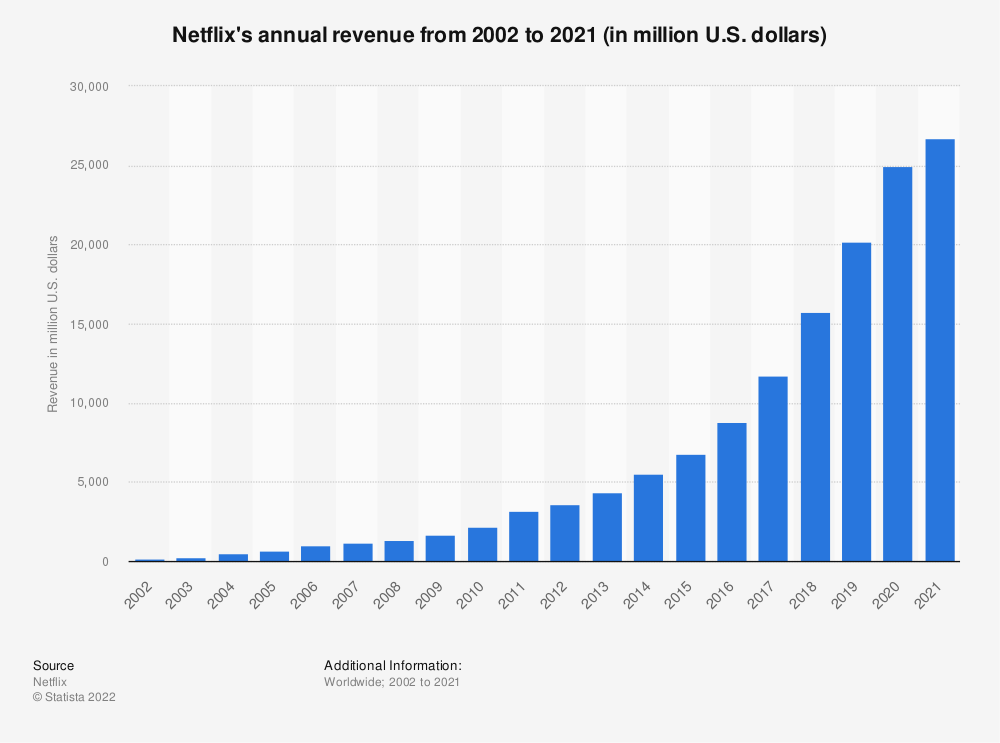
In 2021, Netflix global revenue amounted to $30 billion, up from around $1.7 billion a decade ago. In Q1 2022, Netflix subscriber base stood at just over 221 million subscribers. Although an impressive number, the announcement of this figure sent shockwaves through the industry. It showed a decline of 200,000 subscribers compared to the previous quarter, Netflix’s first subscriber loss in 10 years.
While some attribute this to a post-Covid consumer reaction, Netflix is scrambling to address the issue and appease shareholders. The company is even toying with the idea of offering a cheaper, ad-based streaming service and cracking down on password sharing to help boost revenue.
Despite recent challenges, the question remains: How did Netflix go from Blockbuster competitor to global content producer and streaming giant? Who is the Netflix target audience and how does Netflix marketing strategy appeal to them so successfully?
Let’s do a deep dive into the Netflix current target market and see.
Who is Netflix Target Market?
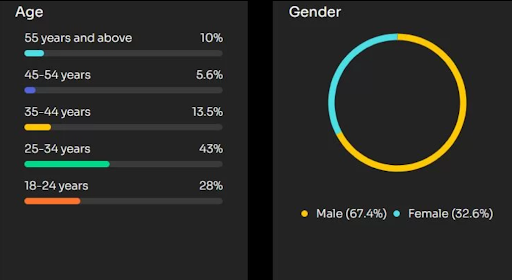
The Netflix target audience is located worldwide in around 190 countries. The typical age of Netflix users is in the younger adult age bracket, a member of Gen Z or Millenials, and with a lower income range of $25-50K.
There are more female Netflix viewers than male, but only just – 52% female to 48% male. In the US, the average Netflix user profile has been found to correlate very strongly with the average US citizen, based on a study of census data.
The target market for Netflix is extremely broad and diverse, and a closer analysis of Netflix target market demographics and Netflix consumer segmentation is a helpful way to dig deeper.
Netflix Target Market Segmentation
To conduct thorough Netflix marketing research, it is vital to gain an accurate understanding of the brand’s target market segmentation. When it comes to mobile target markets, a visit to the Consumer Insights and Audiences Hub is a quick and easy way to access data about mobile user audiences across hundreds of segments.
For now, let’s explore the market segmentation for Netflix from a demographic, geographic, behavioral and psychographic point of view.
Netflix Demographic Segmentation
While Netflix demographics are highest for younger age brackets (Gen Z 70% and Millenials 65%), the Netflix user age shows that older consumers are also a strong audience.
In fact, 54% of Gen X and 39% of Baby Boomers are reflected in Netflix viewer demographics as of 2020. In the US, Hispanic Americans are more likely to have a Netflix subscription, with 70% saying they were subscribed compared to 61% of white Americans. The average Netflix target consumer is not highly educated, with close to 70% having some or no college education.
Netflix Geographic Segmentation
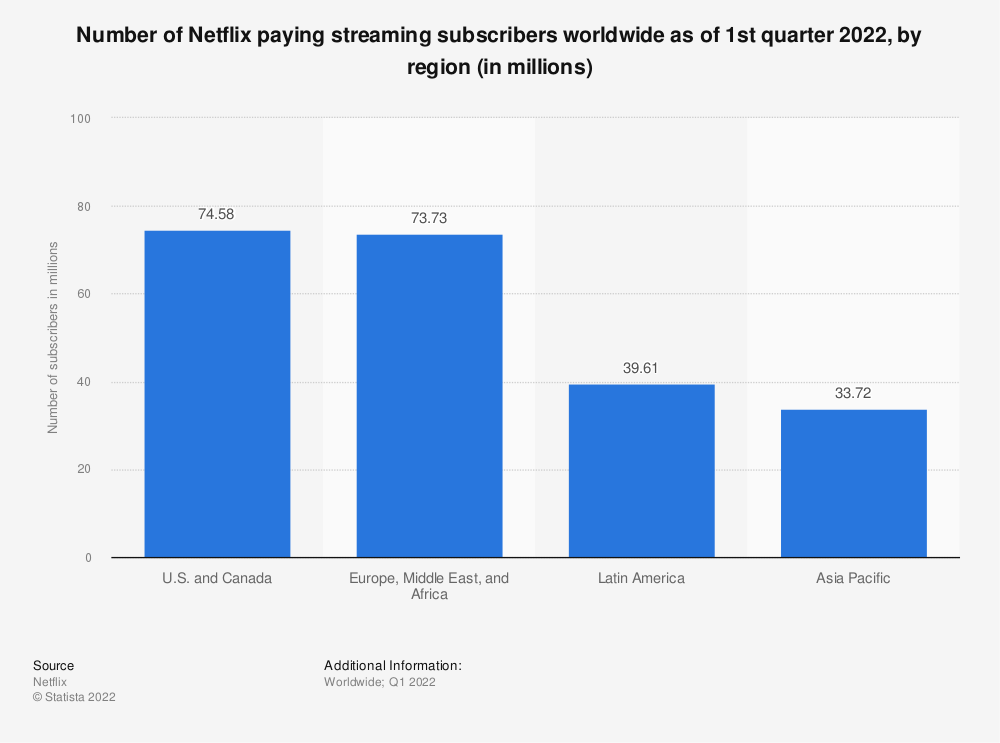
Once, Netflix users had a majority base in the US, however this is no longer the case. Worldwide, Netflix subscriber numbers are split quite evenly between North America, and Europe, Africa and the Middle East combined, with Latin America and Asia Pacific trailing behind.
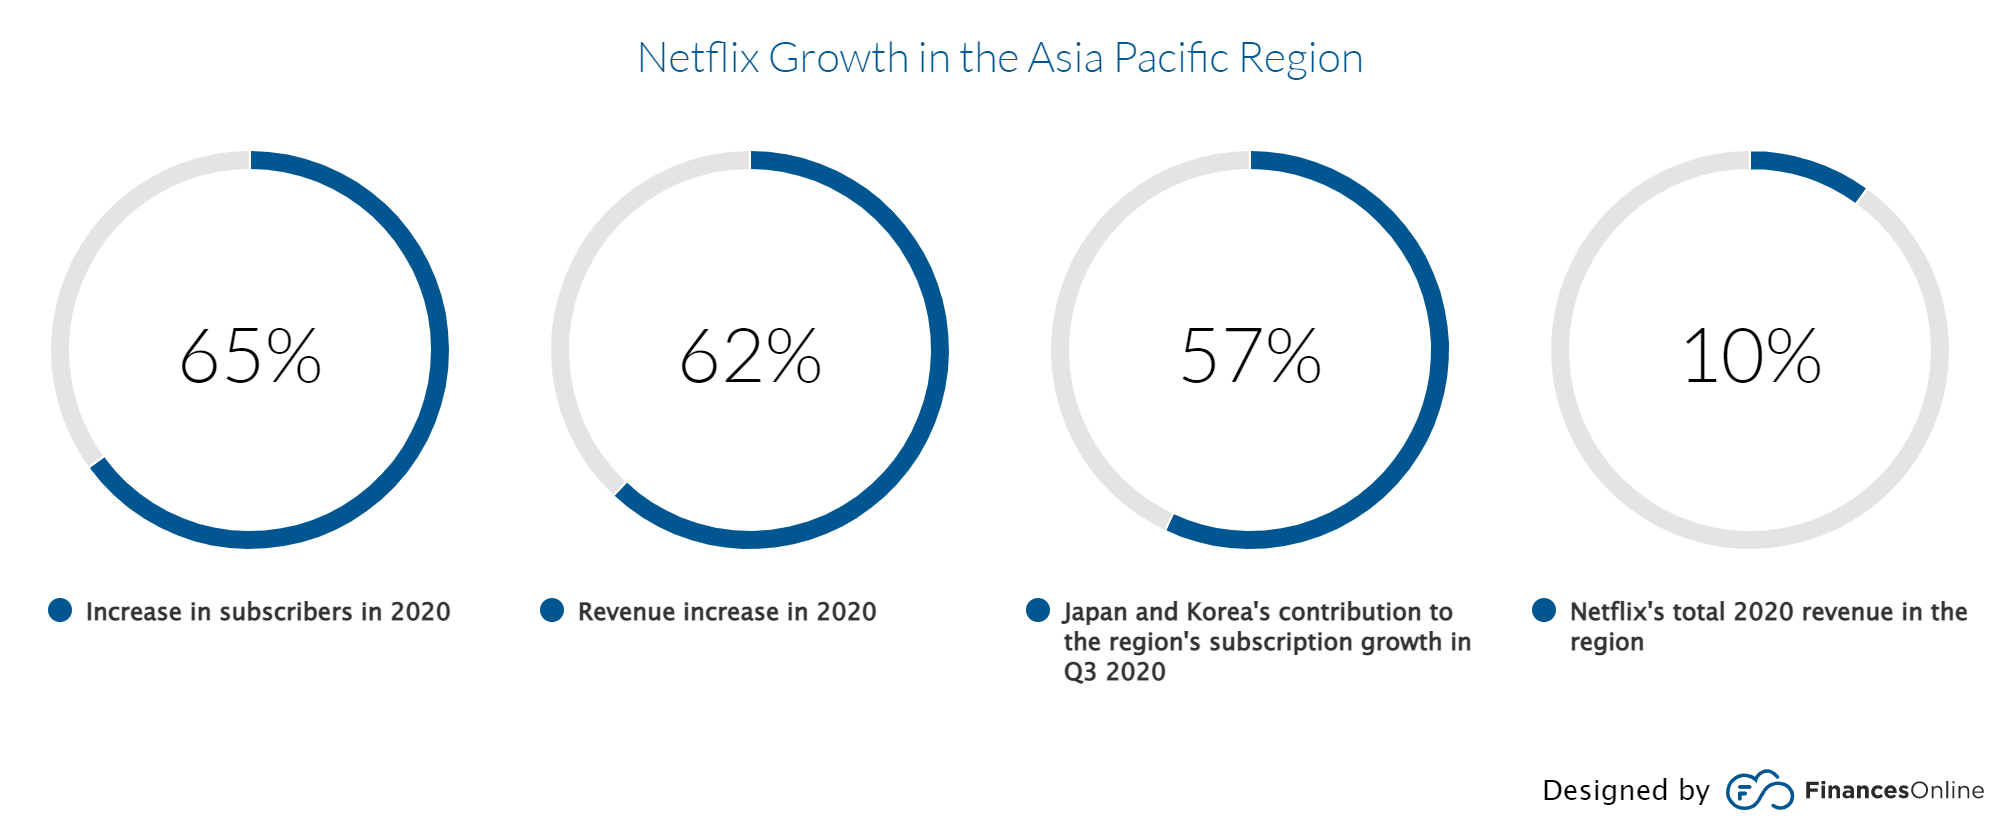
Interestingly, in recent years, the Asia Pacific market has demonstrated the greatest growth in how many Netflix subscribers, with 65% increase alongside a 62% increase in revenue in 2020.
In contrast, Netflix already has high penetration in the US, with 70% of US broadband homes subscribed to the streaming service. This points to the fact that the US is a saturated and mature market, with less potential room for growth than newer target markets in Asia.
Netflix Behavioral Segmentation
While the largest group falls into the $35-50K income bracket, more affluent consumers make up a large chunk of the Netflix target market, with 40% earning $75K or above. Password sharing is rife, with 70% of Netflix consumers who share their Netflix password.
Netflix enjoys very high conversion rates with 93% of users who signed up for the free trial deciding to take a subscription.
For Netflix users, pets are an important part of their viewing experience. Twenty-two percent of users who watch Netflix with their pets say they bribe them with a treat to continue watching together, and a full 12% say they switched shows because their pet didn’t seem to like it!
Netflix Psychographic Segmentation
The Netflix target market is very broad, ranging across all age groups and socio-economic levels. Netflix aims to appeal to a wide range of psychographic segmentations, reflected in the broad content streamed on the platform, from kids entertainment, to documentaries, rom coms, action movies and comedy.
The Covid lockdowns spurred a surge in Netflix consumption, with Netflix accounting for the largest share in streaming minutes in the US (34%). The Netflix audience tends to skew liberal politically, with just 34% of Netflix users saying they identify as conservative.
Netflix Top Competitors
Although Netflix has long been the clear leader among video streaming companies, other streaming platforms have recently begun to catch up – notably Amazon Prime and Disney+. By 2026, Disney+ is forecast to outperform Netflix in global number of subscribers and Amazon Prime is expected to reach Netflix levels of success.
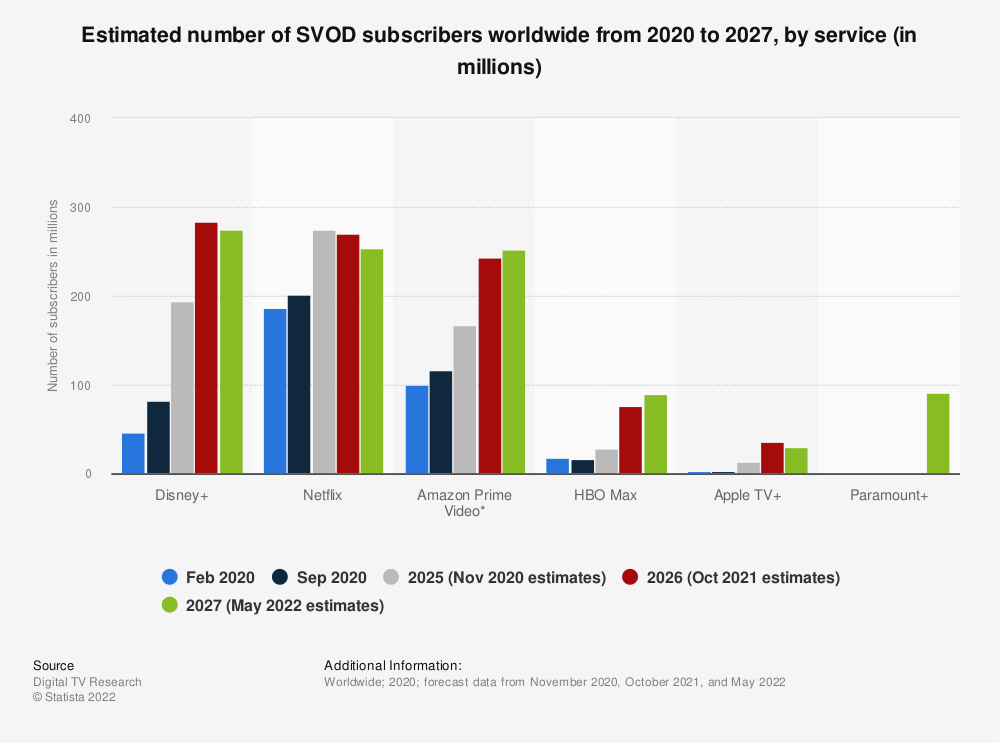
Other competitors include YouTube, whose growth in 2021 was on par with Netflix, HBO Max, Hulu, Peacock and Apple TV+.
Although Apple TV+ is a newer competitor with a far smaller streaming library, it is slowly but surely building a loyal subscriber base. It offers very high quality and targeted niche content, and of course, it has all the strength of the iconic Apple brand behind it. Learn more on Apple Target Market Analysis on our recent blog post.
Netflix Marketing & Branding Strategy
In 2021, Netflix spent over $2.5 billion in marketing, up 14% from the previous year. Personalization of the user experience is a core Netflix marketing strategy. The company uses sophisticated strategies for tracking a wide range of ‘events’, or user behaviors, such as time and date of viewing, pausing or stopping a show, and more. Netflix leverages this data to provide accurate and relevant content recommendations to individual subscribers.
Another key Netflix branding strategy is the in-house production of original and high-quality content. This cements the Netflix brand as not just a streaming platform but a production company that rivals even the biggest names in movie making and TV production.
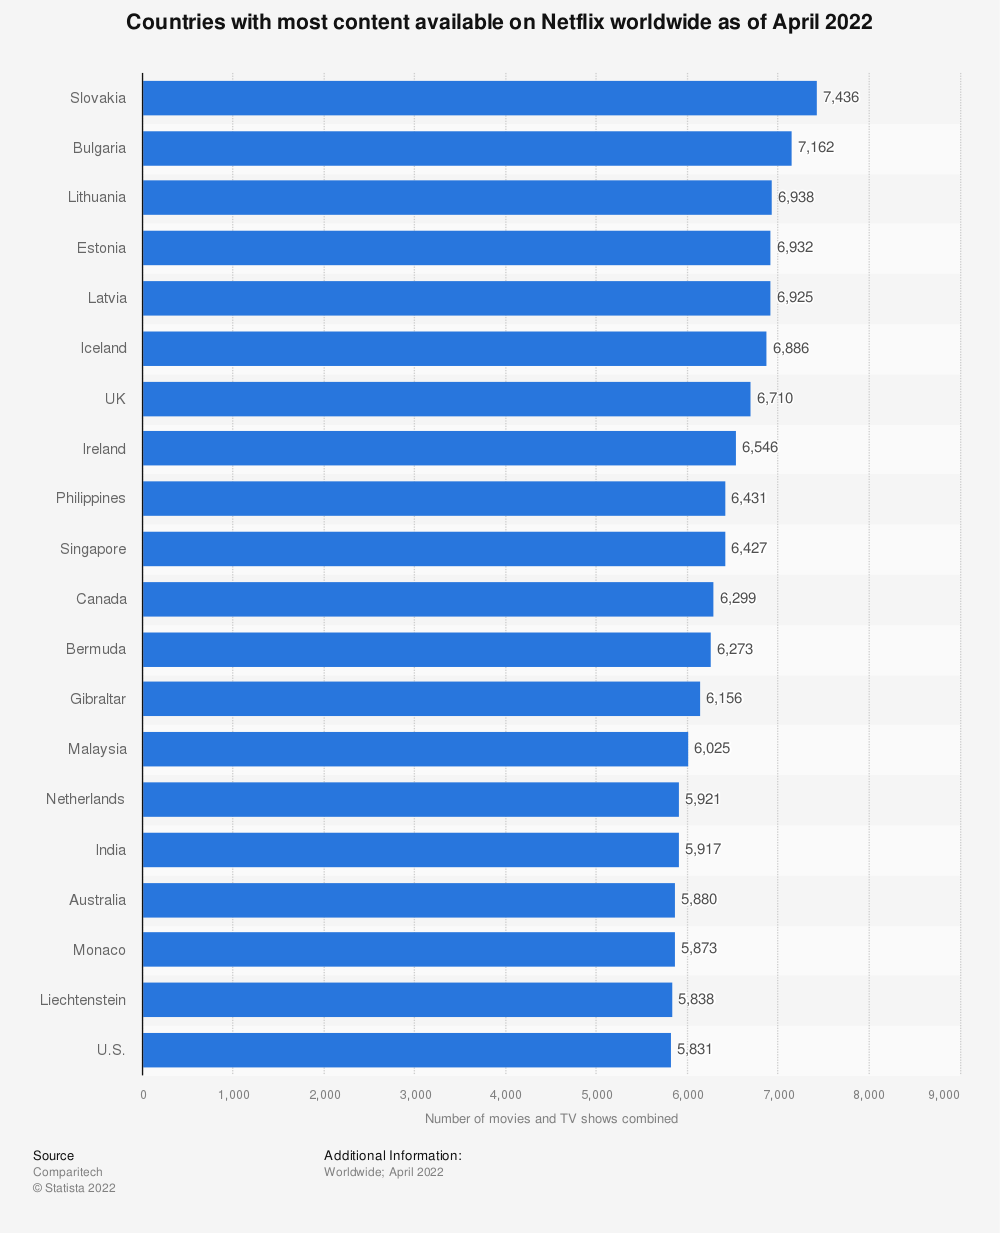
In 2021, Netflix was forecast to spend over $17 billion in content production. Furthermore, Netflix content is curated and localized for different markets to optimize engagement. Slovakia is the country with the largest Netflix content library, boasting over 7400 titles. In contrast, the US comes in at number 20 with over 5800 titles available to subscribers.
Netflix brand analysis also reveals a unique and creative marketing approach for the promotion of specific shows and content. For example, during the 2016 US election season, Netflix ran a very successful marketing campaign for political drama series House of Cards.
The company broadcasted a “political campaign commercial” for Frank Underwood, the fictional president of the popular show, during the live Republican debate. The Netflix campaign was an instant success, trending on Twitter and Facebook within an hour of launching.
Netflix Streamers in United States
Start.io data of Netflix Streamers in the US reflects the large size of the Netflix audience, with close to 9.5 million mobile users who stream Netflix.
The largest age demographic by far is Gen Z and Millennials, who together make up close to 80% of the Netflix audience. Specifically according to data of mobile phone users, there are more males than females who like to stream Netflix, with a strong preference for Android over iOS.
In terms of socio-economic status, the data reflects a clear split. Around 28% of mobile users who subscribe to Netflix earn an income of $25K or less, and nearly 29% have income of $100-$150K.
The audience of Amazon Prime Streamers in the US is significantly smaller than the Netflix audience, numbering close to 4 million. They have a similar demographic segmentation with one striking difference – the ratio of male to female streamers is higher for Amazon Prime: 61.3% of Amazon Prime streamers are male compared to 54.9% for Netflix.
The Disney Entertainment Streamers segment in the US is smaller still, with just over 2.6 million mobile users. Not surprisingly, the Disney streamers mobile audience skews young, with over 80% of the audience aged under 34 years.
These kinds of data points are vital in creating accurate and powerful ad campaigns for mobile audiences worldwide, across a wide range of consumer segments. For Netflix streamers, Amazon Prime subscribers, or hundreds of other audiences and segments, with the help of Start.io Audience data, businesses can access all the relevant insights for better targeting and better campaigns that deliver results.
Netflix FAQs
How many videos are on Netflix?
There are more than 5800 titles available to Netflix subscribers in the US.
How many people have Netflix?
Over 220 million people worldwide have Netflix subscriptions.
How many hours does the average person watch Netflix?
In 2020, Netflix users watched an average of 3.2 hours of video a day, adding up to a collective 6 billion hours every month.
Additional Sources
https://www.dailymail.co.uk/sciencetech/article-9338499/Online-calculator-reveals-long-youve-spent-binge-watching-Netflix.html https://www.statista.com/statistics/760330/netflix-subscription-adults-usa-ethnicity/ https://deadline.com/2022/03/netflix-password-sharing-subscribers-survey-streaming-1234990125/ https://iide.co/presentations/marketing-strategy-of-netflix/ https://neilpatel.com/blog/how-netflix-uses-analytics/
How to define the year that was 2021: Corona Light? The year we learned to live with COVID? The second year of the pandemic?
Whichever name you prefer, it is clear that 2021 was a kind of transition year. The initial shock of the pandemic gave way to a hybrid blend of ‘normal’ life and social distancing. Once again, there was a shift in consumer behavior and this is reflected in Start.io mobile audience data, covering hundreds of consumer segments and the entire globe.
We’ve pinpointed several key segments with notable data shifts that may impact your mobile advertising strategy in 2022. Here are the consumer behavior trends worth keeping an eye on as you kick off a new year and new marketing plan:
Baking and cooking
According to a survey about hobbies during coronavirus, 21% said that they turned to baking in their extra time at home, perhaps because it provides an opportunity to get away from screens and enjoy a wholesome family activity. This is reflected in mobile app usage, with a 16% jump in the usage of baking and cooking related apps in 2021 compared to 2020.
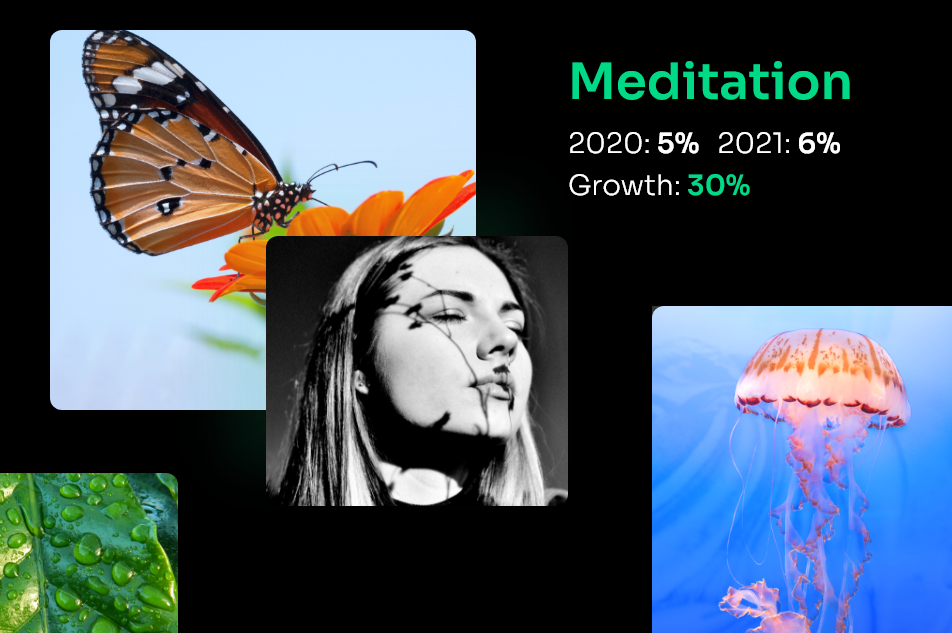
Meditation
The stress of the pandemic has taken its toll. According to the CDC, between August 2020 and February 2021, the US population saw an approximate 5% increase of symptoms of mental health issues (36.4% to 41.5%). It’s no wonder that people are turning to apps and tools to help improve their state of mind. This year saw an increase of 30% in use of meditation apps, definitely pointing to the need among global audiences.
DIY
DIY saw a huge boom during the pandemic, with 25% of DIY fans saying this was due to “finally having the time for it”. This is reflected in mobile audience data too, with a doubling of the number of users interested in DIY apps, from 4% to 8%. With more time at home, and more free time on their hands, DIYers have been taking advantage and will continue to do so as long as it is convenient.
News
After two years of non-stop pandemic news, you might think that people are feeling “news fatigue”, but actually more people are using apps to get their news than ever before. In 2021, there was an increase in 12% of news app usage, showing that people simply can’t get enough of the news and staying connected to what’s going on is still vitally important.

Dating
COVID rules made dating very difficult. In fact, the post-pandemic world has given rise to a new trend: FODA, or fear of dating again! Even so, there’s no stopping love, and dating apps are seeing an uptick, with an overall increase of 30% in usage, from 18% in 2020 to 24% in 2021.
Careers and employment
The Great Resignation is well underway, and people are changing jobs or considering a change in higher numbers than ever before. This is reflected in mobile app usage around careers and employment, with a 27% jump (from 9% in 2020 to 11% in 2021), as people use this time to re-think their aspirations and shift their career path.
Wedding planning
Weddings took a big hit during the pandemic. In spring 2021, it was reported that 7000 weddings in England were being cancelled due to confusion surrounding lockdowns and social distancing rules. As the world opens up, couples don’t want to wait any more, and this can be seen in the 57% increase in usage of wedding related apps in 2021 compared to 2020.
VPN
Work from home was a key characteristic in 2020, and it continued big time into 2021. This was noted in mobile audience data that showed a 101% increase in VPN use, jumping from 17% in 2020 to 35% in 2021. Expect this to continue into 2022, as 61% of remote workers say they will be working in hybrid mode in the future, with 27% saying they will work from home full time.
Video editing
With more work from home, less time spent commuting, and less going out to socialize and for leisure, people are turning to other creative outlets and interests, especially those that can be done at home and on computer. Video editing was a big one this past year, with a 19% increase of mobile audience interest, from 38% in 2020 to 45% in 2021.

Mobile audience data: the key to success in 2022
Mobile app usage is on the rise, and during the pandemic, it was nothing less than a boom. In the business segment, for instance, there was a 220% increase in app usage. The tricky part is getting behind these awesome numbers to analyze the trends and understand what’s really going on across all consumer segments. In light of this, what will the new year look like for mobile users and marketers?
2022 kicked off with the Omicron variant raging around the world, governments working hard to increase vaccination rates, some countries returning to lockdowns, continued social distancing, and a lot of uncertainty among consumers about how to behave. This kind of confusion can expect to give rise to continued use of mobile apps in most segments.
On the other hand, many consumers are experiencing “pandemic fatigue”, with a longing to return to in-person shopping, gym visits, working at the office rather than at home, concerts, vacations, leisure experiences and more. It is clear that 2022 is not simply a case of “2020-too”, but rather the beginning of the return to pre-pandemic life, intertwined with the deeply ingrained, new habits of a hybrid lifestyle that blends online and offline experiences like never before.
With the help of Start.io data gathered from half a million integrated apps and 30 billion SDK downloads, you can gain accurate, powerful insights about audience behavior and drive smarter mobile advertising in 2022. To dig deep into mobile data for your target audience, in hundreds of consumer segments and locations, visit the Start.io Audience hub, or read our recent blog post on Demographic Audience Analysis.
Food. It’s no longer just a source of fuel and nutrition for the body. In recent years, it has become a powerful and competitive consumer segment.
In 2019, a US study found that over 50% of consumers considered themselves “foodies”. More than 60% said they would go to an event just for the food, and 26% had shared a food snapshot on social media in the previous month.
There are entire communities of foodies all over the world who are thinking about food, preparing food, browsing online and offline for food and related items, cooking at home, or dining out. In this blog, we’re going to explore home delivery food trends, what that means for food businesses, and how mobile user data can illuminate food delivery app customer segmentation and advertising strategies for marketers and app publishers in the niche.
The rise of food delivery apps
When COVID hit, the food industry was faced with a dilemma and a challenge.
On the one hand, restaurants had to comply with lockdown orders and social distancing rules, and that meant a severe drop in business. On the other hand, consumers were more focused on food than ever – they became more interested in the kitchen and home cooking, and increased their takeaway purchases too.
These changes to online food ordering trends are so far here to stay. In fact, one in five survey respondents say they are enjoying more takeaway food now than before the pandemic.
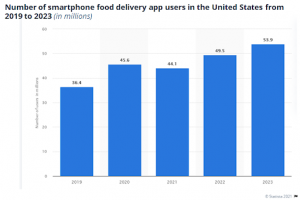
In all these rapidly changing trends and habits, food companies have had to adapt quickly, and restaurants in particular are looking for ways to bounce back and restore their business activity to pre-pandemic levels. One way to catch audience attention and boost restaurant orders is with food delivery apps, which are steadily growing in popularity as the graph below clearly shows.
Food delivery app users: No longer just a niche segment
Food delivery apps were once a niche market, mainly serving the more mobile-savvy and tech-native Gen Z and millennials. However, when faced with lockdowns, restaurants all over the world took to food delivery apps as a way to grab the target audience’s attention, continue to serve customers and increase business opportunities.
This is evident in the success of Uber Eats, an offshoot of the ride-sharing company. During shelter-in-place orders, when ride sharing demand was way down, Uber Eats generated $4.8 billion in revenue from food deliveries, representing over 40% of Uber’s business.
Another way that restaurants have been innovating during this time is the establishment of “ghost kitchens” – kitchens set up for the sole purpose of food delivery, with no in-house restaurant seating. Ghost kitchens are an excellent solution, but they are costly to run, and they come with critical issues of operational viability and scalability.
Before investing in a ghost kitchen, business owners must ask themselves, where is the best location that will serve the largest number of consumers? Where are the foodies located, what kind of service are they looking for, and how can my business provide it? Read on to see how Start.io data insights can help food delivery companies answer these questions.
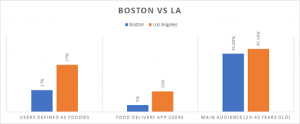
Foodies in Boston vs LA: A Start.io case study
Analysis of Start.io data in Boston and Los Angeles helps paint an accurate picture of the characteristics and behaviors of local foodies.
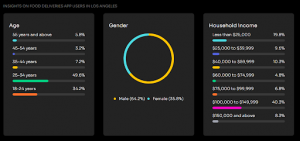
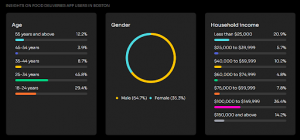
Both cities are home to big communities of foodies, who love dining out and in, however Los Angeles is the definite leader, with 37% of mobile users defined as foodies in LA, compared to 17% foodies in Boston. This is reflected in the activity seen on food delivery apps too. In LA, 16% of users actively order food via their mobile devices, with just 5% doing the same in Boston.
There are similarities between the cities too. In both Boston and LA, affluent consumers are the ones who most use food delivery apps, with over 50% earning $75K or more annually. The younger adult age group of 25-34 year olds is by far the biggest audience, with 49.06% in LA and 45.08% in Boston, and in both cities, men are the majority of food app users, with just over 64% user share.
Interestingly, despite that LA is a more food app-centric market overall, there are in fact over 20,000 mobile users displaying the potential to become food delivery app users in Boston.
What’s next for food delivery app publishers?
The global pandemic of 2020 continues to reverberate its impact on businesses, and for food providers, it has been a game changer. As time passes, people become even more accustomed to the convenience and speed of food delivery apps and home delivery trends continue. Having a grasp of up-to-date consumer data for this user segment is crucial to know what steps to take next.
For example, according to Start.io data in the US, the majority of food delivery app customer segmentation is young millennials with a strong male majority. This audience is tech savvy and fast to adapt to market and technology changes. They are also impatient, and interested in new innovations.
In addition, the past year has seen constant growth in food delivery app users over the age of 40. With the right marketing messaging and effective targeting, food app publishers can reach this growing audience and leverage a valuable potential revenue stream.
Online food ordering trends: All you need to know
This Start.io data, and more like it, is a powerful way for food businesses and restaurant owners to identify the best target audience for food delivery in different locations. Then, they can make more accurate and financially viable decisions about things like ghost kitchen set-up and food delivery operations.
With the launch of the Start.io Audience Segments hub, insights like these are available for 500+ consumer segments in every niche, from food to finance, travel to teens, beauty shoppers to burger lovers. This up-to-date mobile user data covering hundreds of locations worldwide, accessible instantly via a simple search console.
Be sure to check in to Start.io Audiences Hub and start taking advantage of data to boost your performance in the food delivery app and online food ordering segment.
For advertisers in the mobile ecosystem, there’s no such thing as “too much” audience data.
Data-based insights about the behavior and interests of the target audience is always the key to effective ad campaigns. It is also what you need in order to focus budgets on the right consumers at the right place and time. But the more data you have, the harder it can be to separate the wheat from the chaff, and find the nuggets that will really have the impact you need for campaign performance.
That’s the motivation behind our Audience Segments hub, where you can discover up-to-date data insights about mobile users among dozens of consumer segments, in hundreds of cities, states and countries, worldwide. Read our latest blog posts about Nike Target market analysis and Tesla Target market analysis to learn more about these insights.
The Start.io network is constantly gathering mobile user data in real-time, all over the world. This massive pool of valuable data provides a real-time “snapshot” of what consumers are doing, where they are shopping, what they like to buy, what mobile device and carrier they use, and more. And all those insights are now available to Start.io advertisers, with just a click of a button.
Audience Segment Data: It’s Totally Up to You
Our Audience Segments page is designed to provide you with easy access to a vast range of data sorted according to consumer segments, so you can pick and choose the ones most relevant to your business. Plus, you can narrow down your data results according to location, so you can explore what’s happening on the ground, right now, among your target audience.
Use this information to craft accurate and effective mobile ad campaigns for specific user segments and locations. And the best part of the Audience Segments hub? It’s completely up to you. Start.io’s Audience Segments hub provides 30 different types of audience segmentations, divided into different states, countries, and cities across the world – you do the math.
Coffee Enthusiasts in Cleveland, Job Seekers in Jakarta, New Parents in New York – with a wide array of niches and global locations, the possibilities are endless. Simply select your relevant segment, choose the location, and explore the data.
But that’s just the beginning, and just a drop in the sea of the Start.io data available to advertisers. At the Audience Segments hub, advertisers can browse the audience segments by category and location, at no cost. Then, take the process to the next level by contacting Start.io and activating the chosen audiences in mobile campaigns.
Case in point: Father’s Day Approaching…
We invite you to leverage Audience Segments for general ad campaigns or access the data to help you create specialized campaigns for seasonal marketing and upcoming holidays. With Father’s Day approaching, for example, Start.io advertisers are diving into Audience Segment data to target potential mobile audiences likely to be browsing and shopping for Father’s Day gifts.
For instance, the audience segment of Car Owners, a much-loved topic among dads everywhere, has a massive potential audience of 168 million mobile users worldwide who own or intend to own a car.
The audience segment of Fitness Enthusiasts is made up of 64 million mobile users, offering rich opportunities for fitness brands to target relevant users with Father’s Day promotions around health, sport and fitness.
Let’s take a closer look at the Car Owners audience segment in India, numbering over 28 million mobile users. This audience is more than two-thirds male, with nearly 60% in the 25-44 age bracket. The data has identified a huge segment of consumers who are both interested in cars, and likely to be celebrating Father’s Day with their families.
For advertisers of auto and related products in India, this is a prime audience for targeting with relevant mobile ads in the leadup to Father’s Day. And thanks to Start.io Audience Segments data, advertisers can now explore and activate this audience to get more from their Father’s Day mobile ad campaigns.
These are just a few examples of the specific audience segments that can be targeted from among Start.io’s vast global base of mobile users and 1 million integrated apps.
For your next mobile ad campaign, check out Audience Segments first. You’ll be amazed by the power of Start.io to select the exact data insights you need to optimize your mobile marketing activity – what you need, when you need it, with just a few clicks. Try it!
For more info on marketing plan for 2022 read our year-in-review blog post.
Data privacy.
It’s the hottest topic right now, and it’s all thanks to the upcoming changes to Apple’s IDFA.
Apple’s strategic move to boost IDFA data privacy for iPhone users affects everyone in the mobile advertising industry, from ad networks to app developers, digital marketers, in-app advertisers, all the way to consumers who will benefit the most and gain greater control over their online data exposure.
Here at Start.io, we are geared up and ready to handle the challenges that this privacy revolution will bring. And we want to help you thrive in the face of Apple’s turnabout. So let’s start at the beginning.
What is Apple’s privacy change really all about?
Up till now, advertisers have targeted iPhone users with their IDFA, “Identifier for Advertisers” – a unique ID that lets advertisers track and collect the user’s in-app activity in order to target them with relevant ads. According to Apple, every app has an average of six third-party data trackers, all of which track, collect, and monetize its users’ data.
For Apple’s next software release in early spring 2021, the company is instituting a revolutionary change to its tracking policies known as App Tracking Transparency (ATT).
Via ATT, Apple will start requiring that apps and advertisers attain the user’s permission in order to use the IDFA for tracking and ad targeting. Apple’s new privacy policy aims to give app users control over how their data is handled and by whom.
Users can manage their own data tracking permissions, choosing to opt-in or opt-out of data tracking for each individual app. It’s a major step forward for data privacy on the consumer side.
On the other hand, it puts app owners in a tough position. Developers use IDFA to attribute app installs and tie app events to retargeting media across iOS devices. The inability to do this across the board will make it much more difficult to measure campaign performance, target users with relevant ads, and optimize revenues from app monetization.
The ramifications are deep and broad
Google acknowledges that publishers “may see” a palpable impact on their Google ad revenue on iOS once Apple’s policies take effect, due to reduced visibility into performance metrics and measurement.
In addition, Google decided that it will no longer collect and use the IDFA in its own iOS apps for advertising purposes, and will therefore not display the opt-in permissions prompt to users in those apps.
Another player that will take a hard hit is Facebook. The social media giant says that ads that are not personalized are able to achieve only half the value of personalized ads monetized in Audience Network. Bottom line? Facebook could lose billions in the next quarter when Apple’s ATT policy gets going.
Apple offers an alternative
Of course, Apple is well aware of the obstacle the new IDFA policy will be for app developers and advertisers to measure, analyze and attribute user data for all-important optimization and monetization activity. So it has introduced its own attribution solution. Introducing SKAdNetwork.
While SKAdNetwork does partially remedy the gap, what it doesn’t do is to provide the level of granularity that platforms currently offer to mobile marketers. Here are the main limitations of SKAdNetwork as an alternative solution:
- ROI & LTV: The available measurements after app install offered by SKAdNetwork are way below optimal in terms of the window available for measurement and the granularity level.
- Data granularity: The data presented is minimal, restricted only to campaign level. In addition, the data only covers 100 campaigns for each network and each app.
- Delay with postback: A minimum of 14-hour delay will occur between installs and reporting. Real time, rapid optimization is therefore much harder to do.
- Risk of increased ad fraud: The SKAdNetwork may make it easier for fraudulent advertisers to create fake traffic, as well making it more difficult to track fraudulent ads and advertisers.
- No support for attribution other than downloads: Deep linking is not supported by SKAdNetwork, and only downloads can be attributed, which makes it much harder to conduct accurate attribution activity.
What else you can do
Clearly, the industry is bracing itself for the impact once the new IDFA changes kick in. Snap Inc, for example, recently stated that there will be a risk of interruption to demand, and the company has been preparing for a future far more focused on first-party data.
No matter how big or small, every player in the mobile app advertising industry must prepare for the upcoming IDFA changes, and here are some ways you can:
- Recalibrate for long-term strategies: Developers must start to consider how their conversion architecture and user data strategy must adapt in order to support long-term value for their advertisers.
- Shifting budgets to Android: Many companies are moving more budgets to Android, out of range of the fallout on iOS.
- Pivot to contextual targeting: Change your mindset from targeting at the individual user level and rather towards a more subtle and nuanced contextual targeting.
- Change your approach to attribution: Move away from 1:1 attribution methodologies and towards probabilistic modeling approaches with the help of existing MMPs (mobile measurement platforms).
- Optimize your permissions request: Convincing users to give you permission to track their IDFA in an era of App Tracking Transparency is critical. Collaborate with your marketing department to craft effective messaging for your opt-in request.
Your partner, always
At Start.io, we are no strangers to the dynamic shifts happening all the time in the mobile app advertising and monetization industry. And that’s true today, with the IDFA changes on the horizon.
We’ve been working hard to ensure that Start.io is SKAdnetwork compliant, so that we can be in the best position to partner with you during and beyond the transition to ATT. Need assistance and guidance as the release of iOS14 approaches? Don’t hesitate to contact us today.
GameStop’s Stock Fluctuation
Looking at 12 months of data from Start.io indicates that GameStop’s stock fluctuation has little to do with its revenue and overall health, which has seen rises and falls in foot traffic more closely correlated with the COVID pandemic.
The everyday investor follows company financial reports and official statements to evaluate the stock price versus the current performance and outlook. High-end financial market players are using real-time business insight tools to better assess their portfolio’s business outcomes.
Given the fact that the last quarterly report of GameStop was released on December 8, 2020 and the full annual report was on March 27 2020, very early in the pandemic, it’s quite challenging to find any evidence that would show an economic factor supporting a clear investment decision right before the explosion.
The last few weeks have sent GameStop’s stock on a turbulent roller-coaster ride, with severe peaks and equally dramatic drops. Looking at 12 months of data from Start.io indicates that the company’s stock fluctuation has little to do with its performance, which has seen rises and falls in foot traffic more closely correlated with the COVID pandemic and may be influenced by the trend of moving to e-commerce.
Robinhood’s army that makes investments with the tips of their fingers are probably the same ones that are shifting to a fully online shopping experience.
GameStop Data Tells A Different Story
GameStop has 4,000+ brick and mortar stores spread across the US. To get a clearer picture of GameStop’s actual foot traffic and see if the hype was warranted, Start.io pulled historical data from its mobile data platform.
Below is Start.io’s data that charts the visit trends across all US-based retail stores during the last 12 months. What this shows is that the pandemic has had a tremendous impact on GameStop’s business. There is an upwards trend running from the end of December 2019 through January 2020, presumably due to holiday purchases.
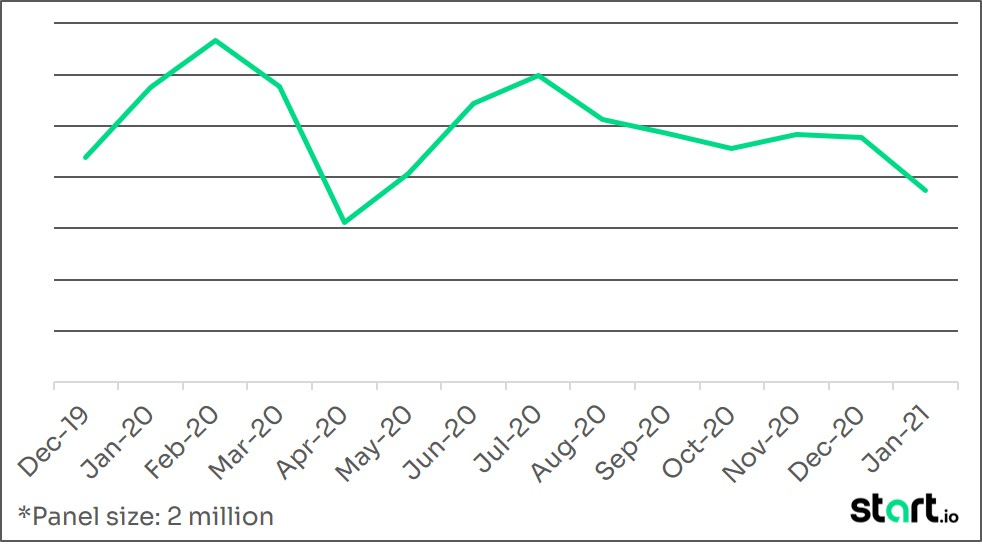
A significant decrease in traffic during March and April corresponds with pandemic-related stay-at-home orders as the virus started to ravage the country. There is a positive trend around June and July, due to many parts of the country opening up again, but the increase didn’t reach earlier numbers.
The fall and winter months display another negative trend that aligns with the later waves of retail being shut down in different US states. Clearly, what has had a real and lasting impact on GameStop is the continuous opening and closing of retail outlets.
There is a significant gap between what happened in the stock market and the reality on the ground. While there are aggressive moves on all fronts with high volatility in the stock market, the retail stores have been directly impacted by the pandemic yet are still attracting customers and traffic, not shutting their doors. As to whether GameStop’s stock is a strong investment opportunity, only time will tell.
Disclaimer: The information contained in this review is not intended as, and shall not be understood or construed as, an advice, analysis, recommendation, professional review or otherwise with respect to GameStop, including its performance, financials or securities, nor shall it be used for such purpose.
Start.io is not a broker or a dealer, nor an investment advisor, and does not have any access to non-public information about publicly traded companies, and this review is not a place for the giving or receiving of financial advice, advice concerning investment decisions or tax or legal advice.
This review is based on Start.io’s internal analysis of data available to Start.io throughout its medias and data platform. Start.io does not guaranty for the accuracy of this data.